Summary Tab
 Updated
by
Sam McDougall
Updated
by
Sam McDougall
Select 'Reports' to access the Summary page.
you will be presented with 3 tabs, Summary, Simulations and Courses.
The summary tab provides high-level metrics, looking at your Risk Score, Active Users Enrolled, % fail rate on simulations, % courses completed and the average score on the assessments at the end of the courses.
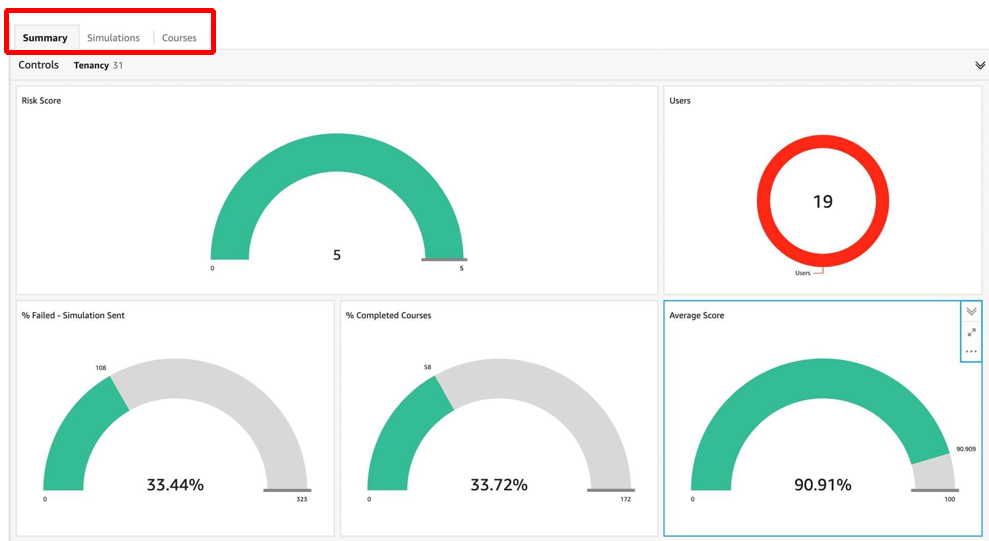
Users:
Current number of Active Users in your Tenancy
Risk score:
A gauge from 1 to 5, determining your current risk as an organisation based on your % of sims failed
% Failed:
Number of Simulations clicked as raw value and as a percentage overall
% Completed Courses:
The number of courses completed against sent as a raw value and as a percentage overall
Average Score:
The average score of all courses taken in the tenancy
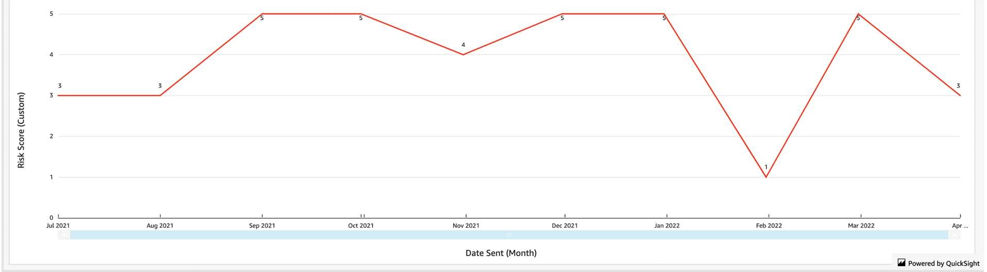
Historical Risk Score:
You can view a historical risk score via the graph at the bottom of the dashboard, this shows a summary and trailing Risk Score by month