Reports Overview
Reports Overview. What is Reports? Reports is a single place to see your organisation's human cyber risk. It brings together risk, simulation, course, user and dark web data, letting you: View: With…

Updated
by Nick Bates
Reports Overview
What is Reports?
Reports is a single place to see your organisation's human cyber risk. It brings together risk, simulation, course, user and dark web data, letting you:
- View: With a range of widgets, you can view high level statistics across Risk, Simulations, Courses, Users and Dark Web Monitoring.
- Customise: Change the look of your dashboard with the customisation capabilities.
- Exporter:
- Export your report(s) as a PDF, PowerPoint, Excel or CSV from a selection of our Templates or customise your report(s) export using the selection of available datasets.
- Schedule automated exports to be sent directly to you.
- Data Tables ready to download on their own.
- View Export History of every dataset that has been pulled or sent.
Navigation Within Reports
- To navigate to Reports, select Reports in the left hand menu.
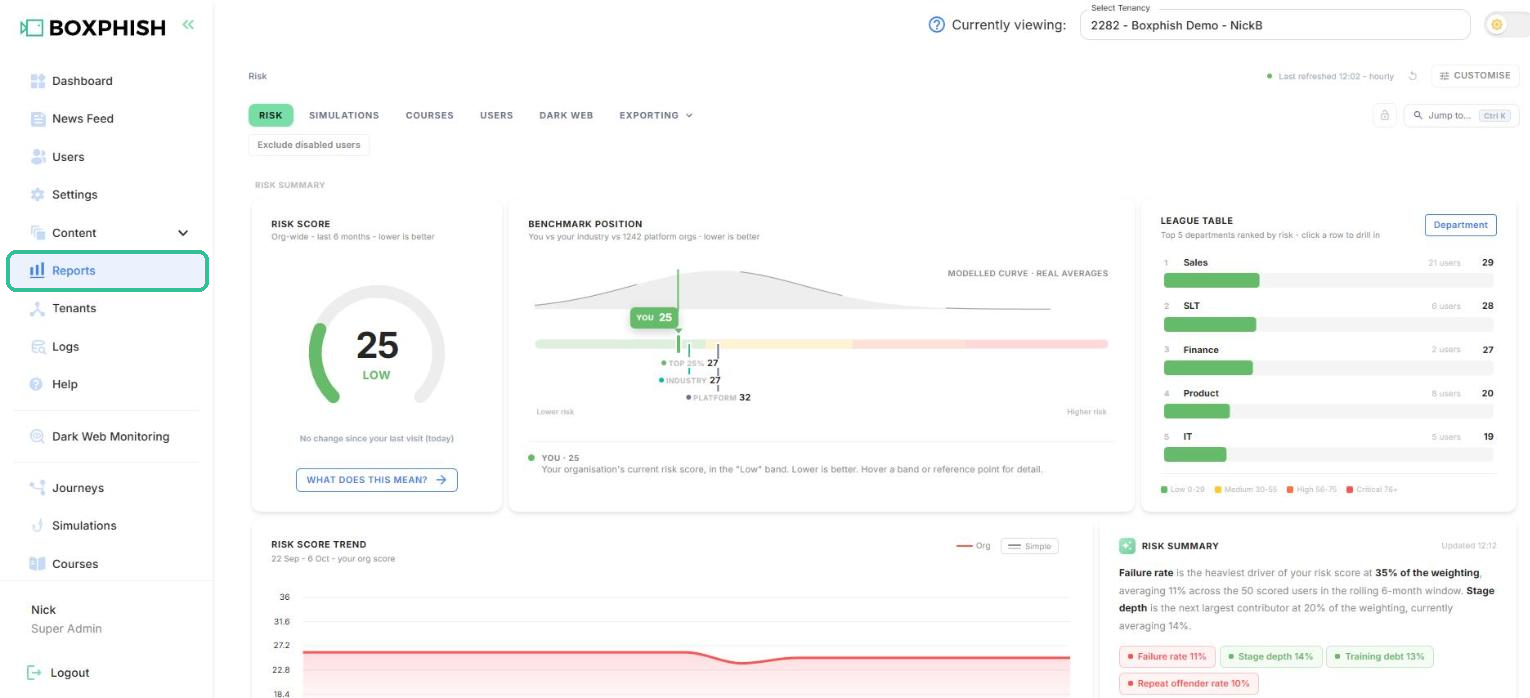
- You will land on the Risk page. By selecting tab titles from the top bar, you can navigate between tabs for:
(Select each tab to find out more about each page)
- Risk: your organisation's risk score and what drives it.
- Simulations: phishing simulation results.
- Courses: training assignments, completion and scores.
- Users: every user in one table, with a profile page for each.
- Dark Web: breached accounts, if dark web monitoring is enabled.
- Exporting: build, schedule and download reports.

Page Controls
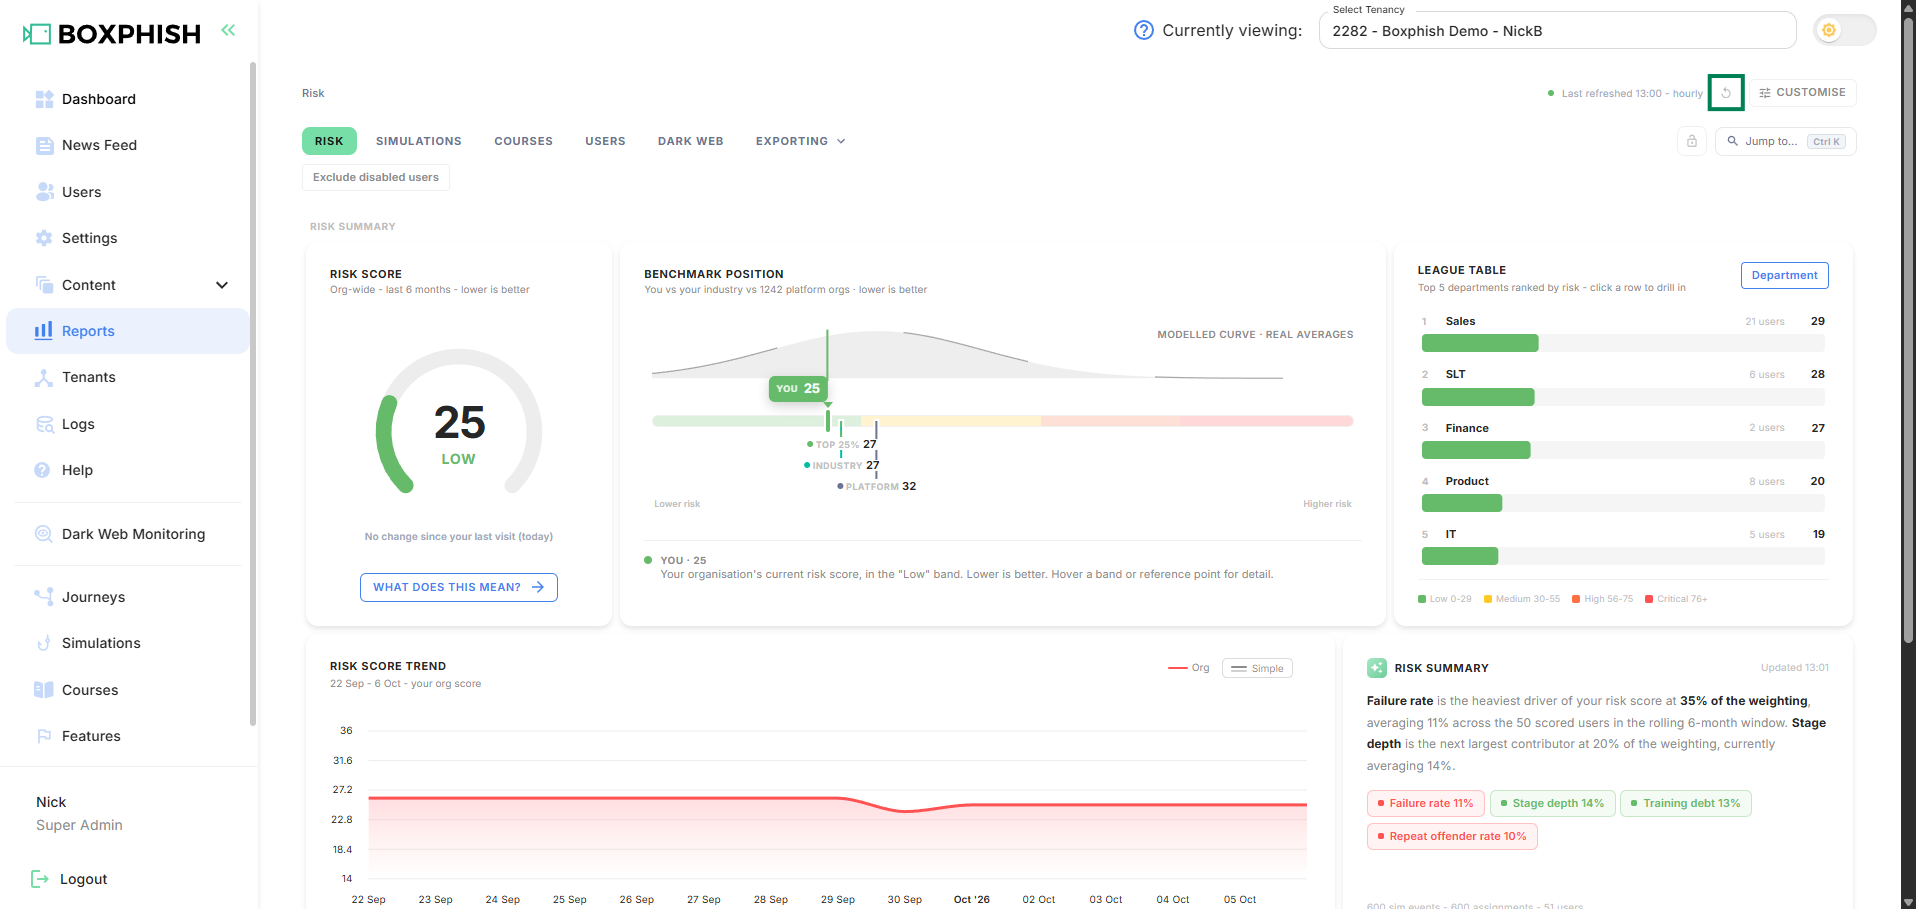
- Last refreshed: data refreshes every hour. Click the circular arrow to refresh now.
- Customise: show or hide widgets.
- Jump to (Ctrl K): search for any page, simulation, user or department.
- Padlock: pins the tabs and filters to the top of the screen while you scroll.
- Filtering: change the data displayed based on the selected filters
- Back and the breadcrumb take you to the previous page.
Last Refreshed
- Data in Reports automatically refreshes every hour. If you wish to refresh the data at any given moment, select the refresh button located in the top right corner.
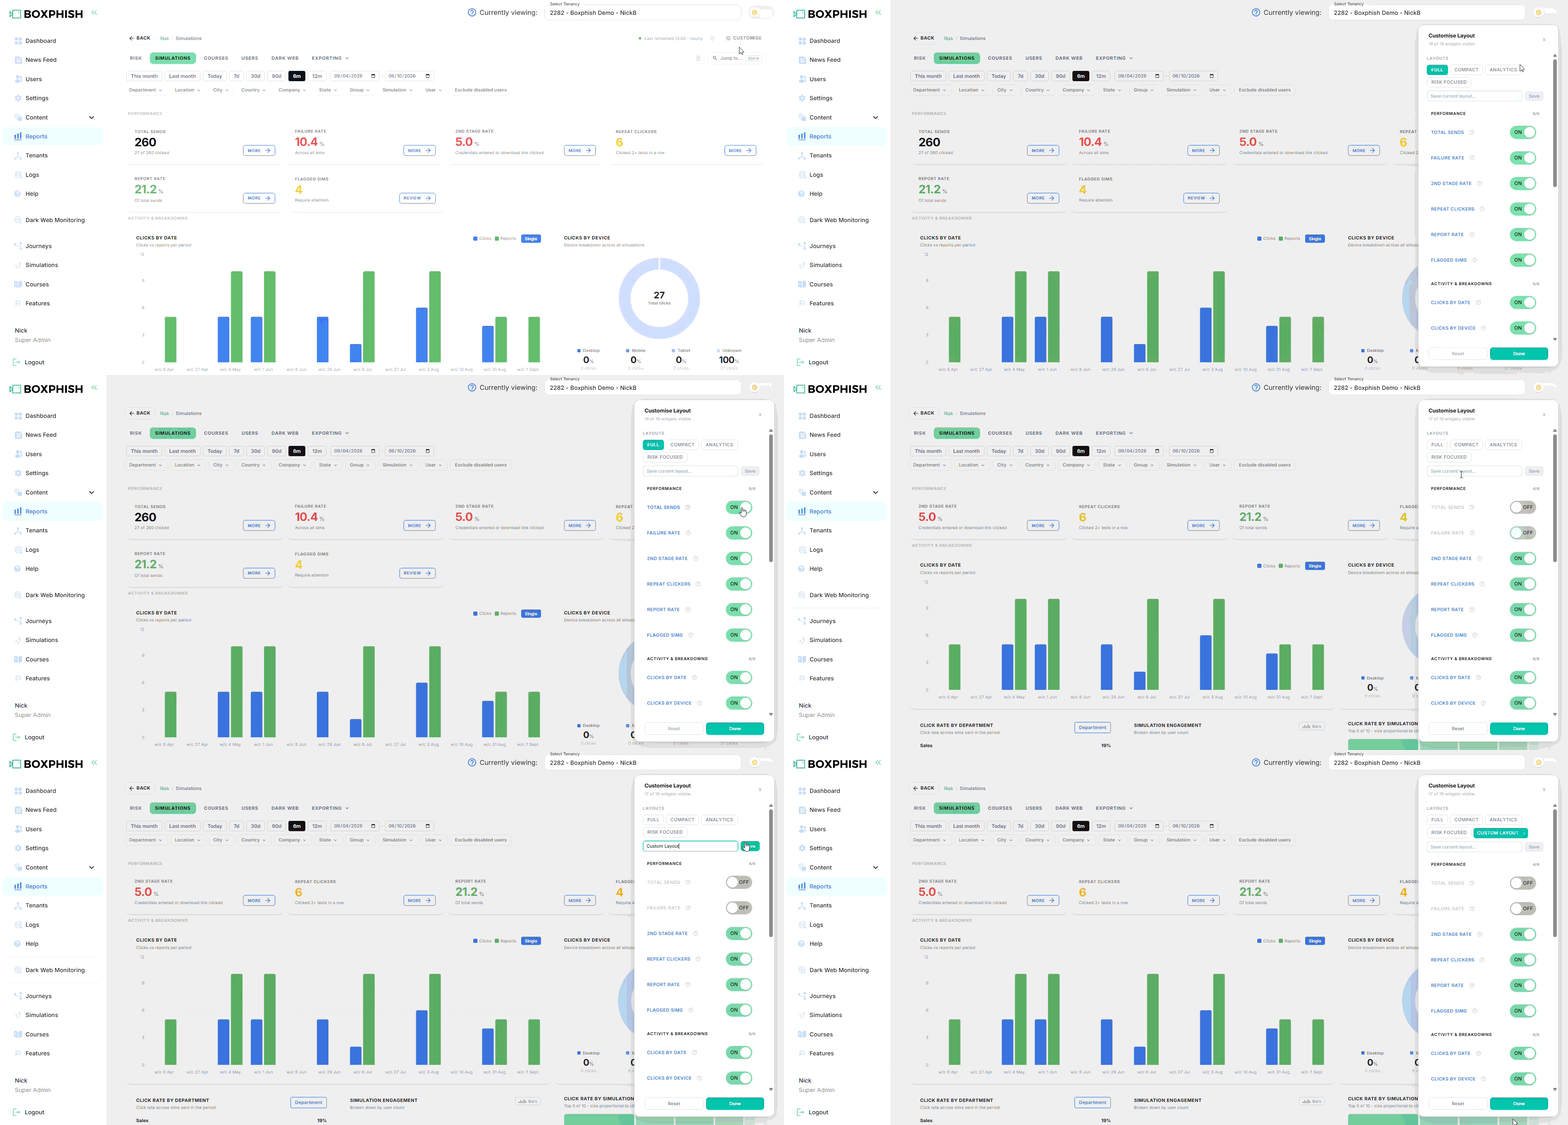
Customise
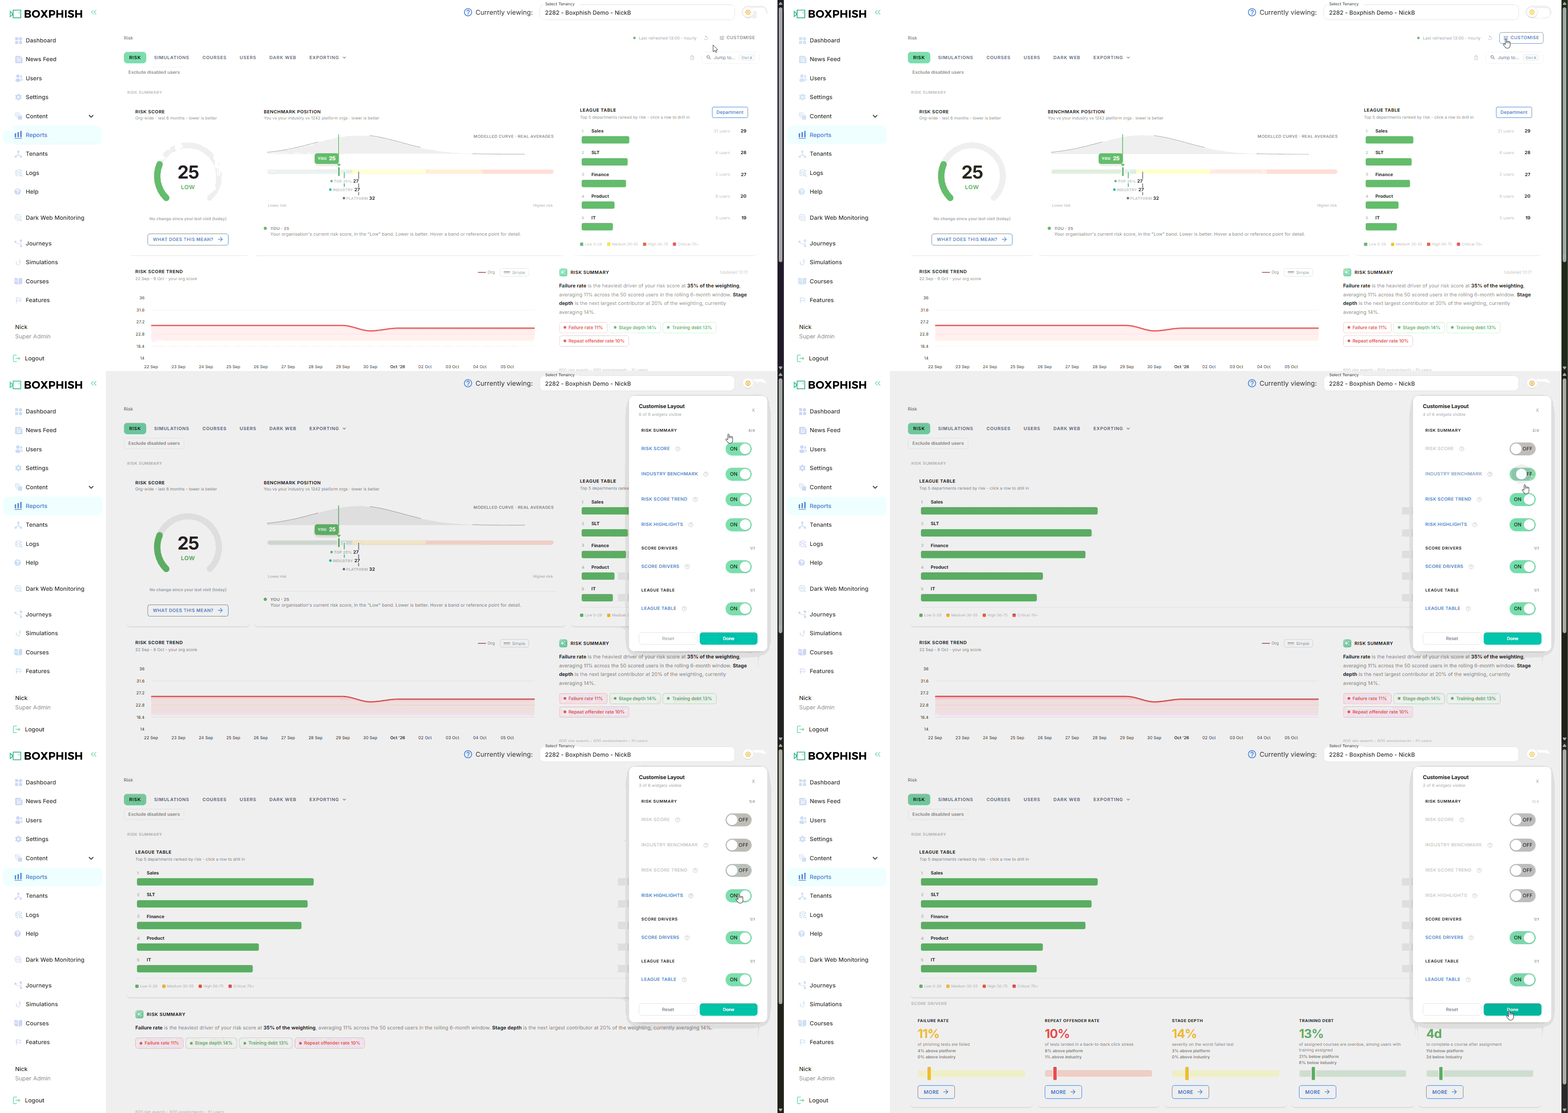
Control which widgets you wish to see on each Reports page.
- Click Customise at the top right.
- Select the widget toggle that you wish to add / remove.
- Click Done.
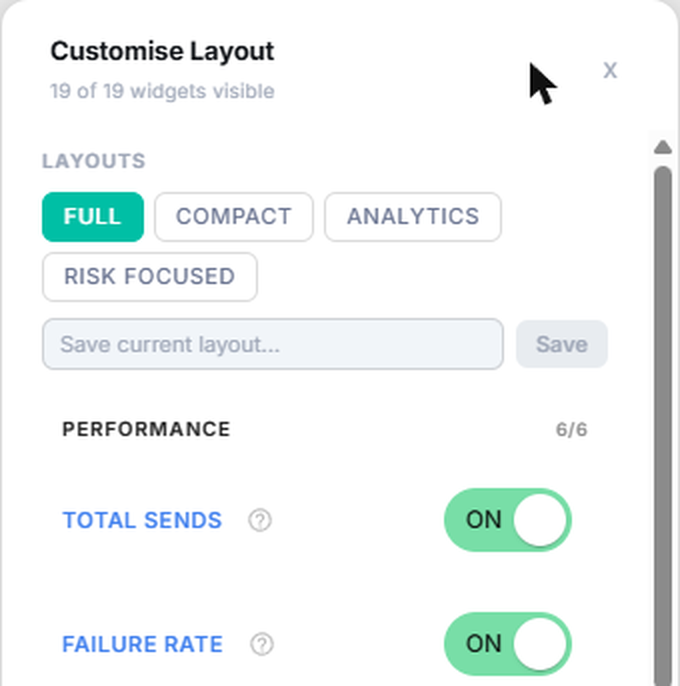
Select from preset layouts (available on Simulations and Courses page)
- Click Customise at the top right.
- Select the preset layout you wish to use.
- Click Done.
Save custom page layouts (available on Simulations and Courses page)
- Click Customise at the top right.
- Customise your page to display the widgets you wish to see.
- Enter a name for the customised layout in the name bar.
- Click Save.
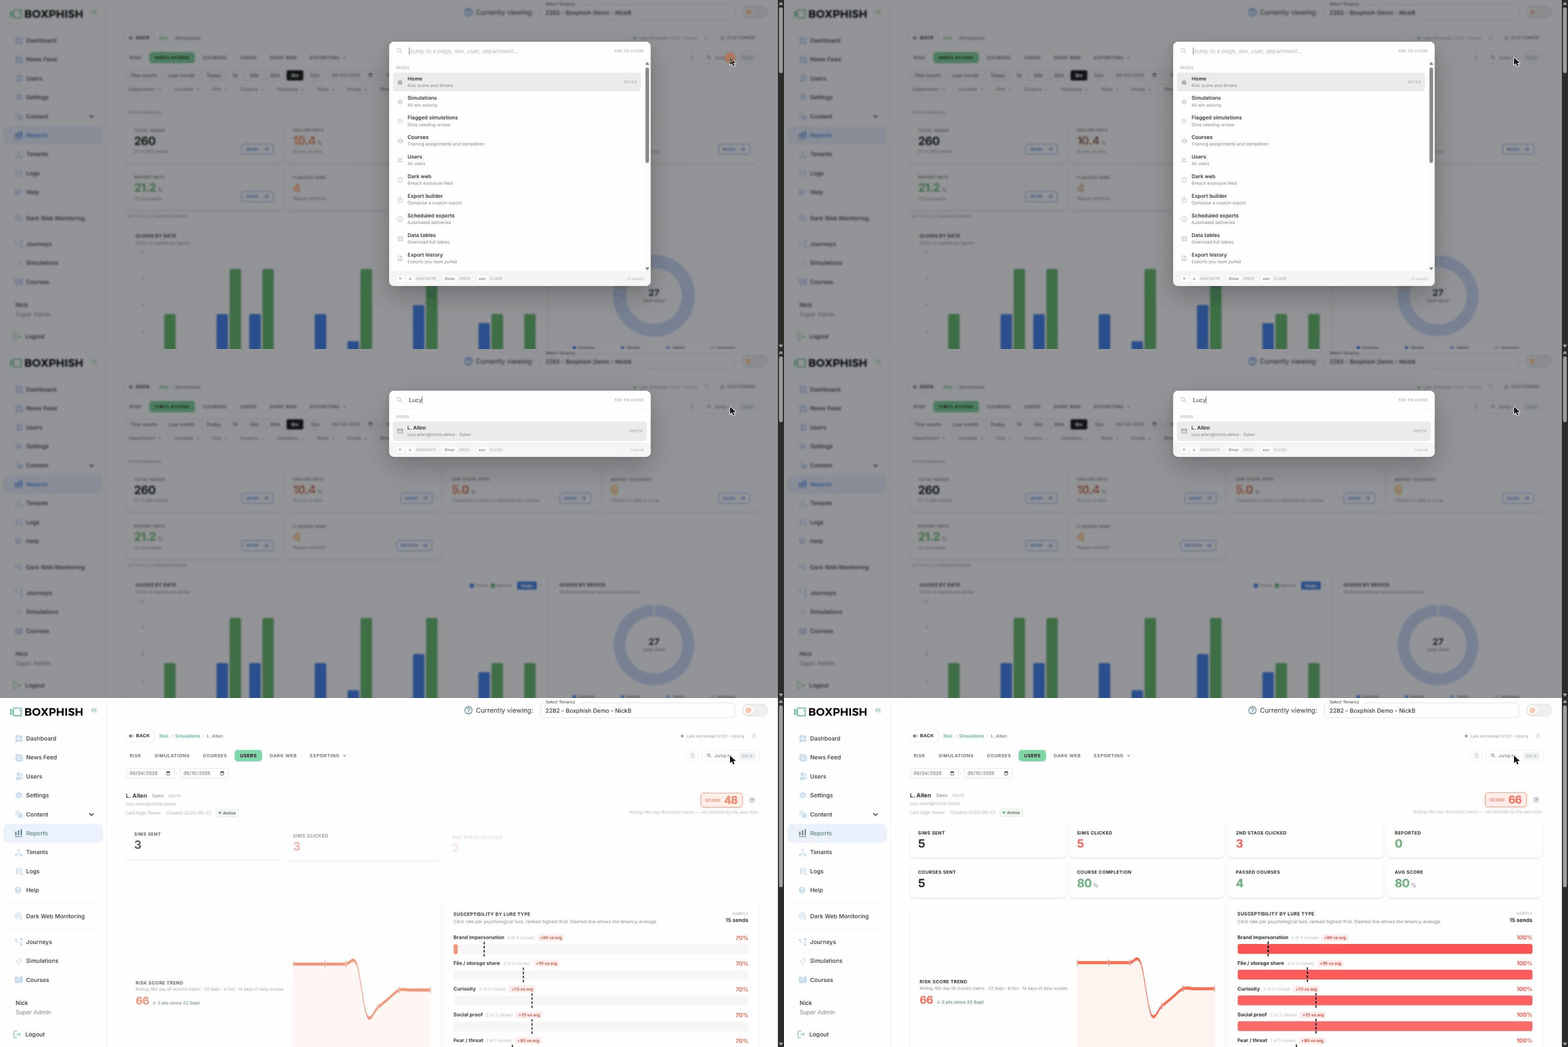
Jump to
- Click Jump to, or press Ctrl + K.
- Start typing a page name, user, simulation, department, etc. that you are looking for.
- You can use your mouse to select the result you want or use the arrow keys to choose a result, then press Enter to select.
- Alternatively you can press Esc to close.
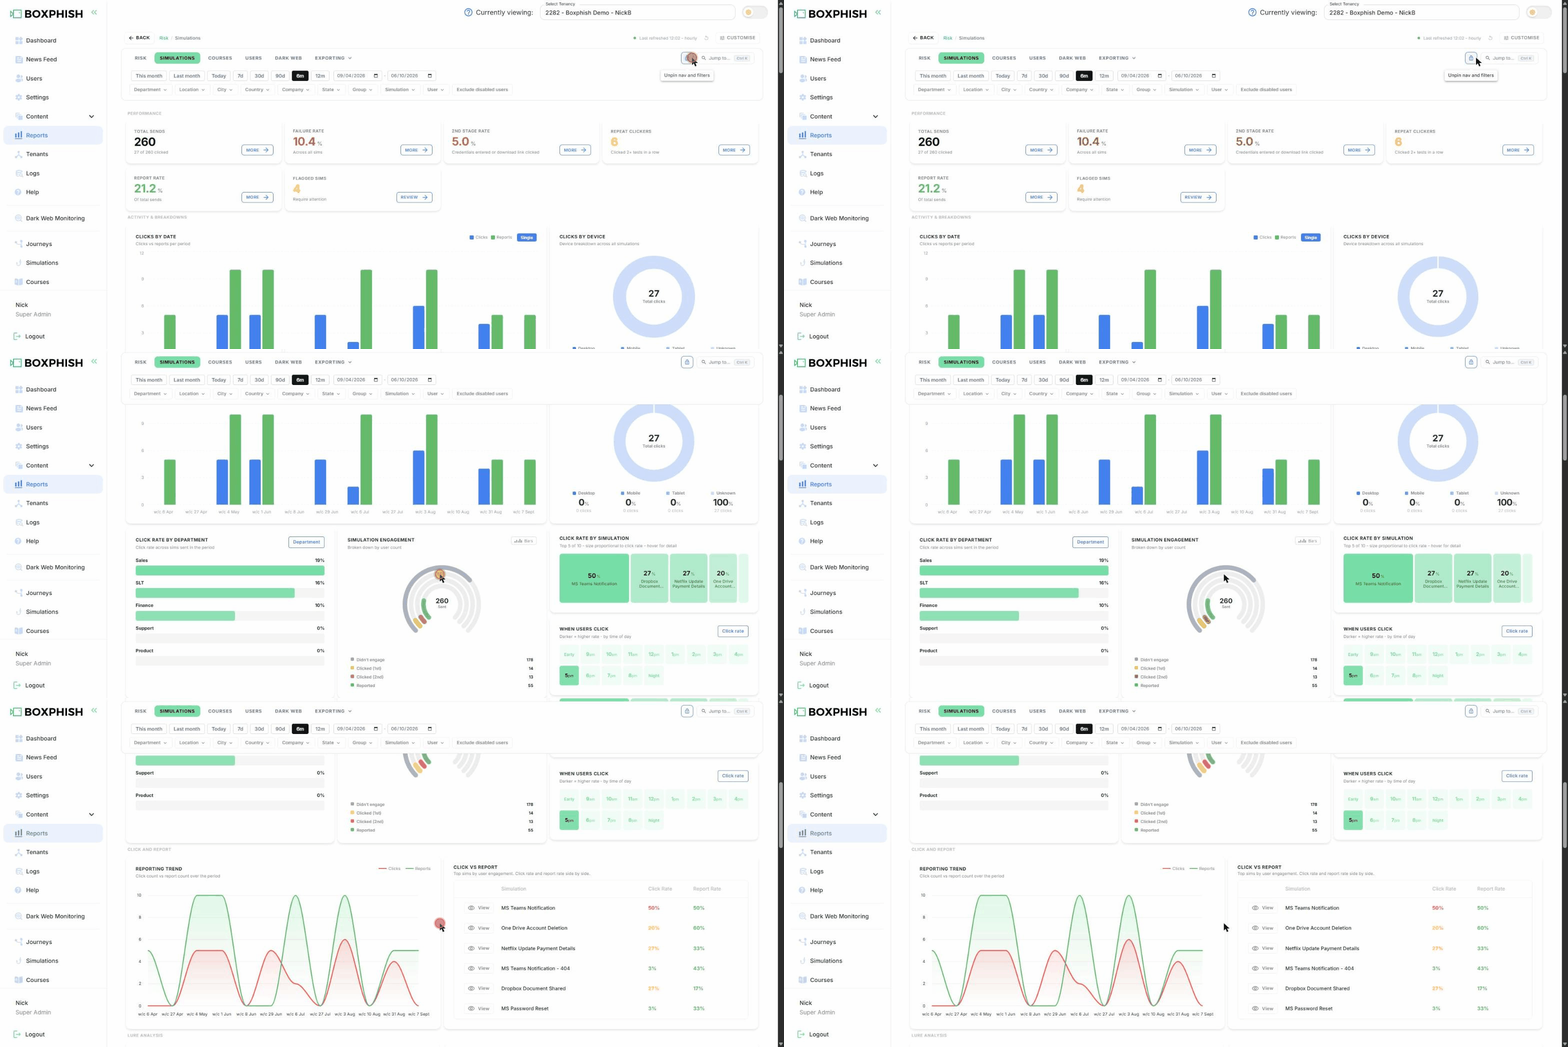
Padlock
- Click the Padlock icon in the top right corner.
- When you scroll down the page, the top bar will now be locked to the top of your screen.
Filtering
There are a wide variety of data items to filter from.
To filter the data being displayed on a page:
- Select a filter item
- Preset date filters will automatically apply
- For a custom date range
- Selecting the text will allow you to type in a date.
- Selecting the calendar icon will open a calendar dropdown.
- The left date is the Start Date, the right date is the End Date.
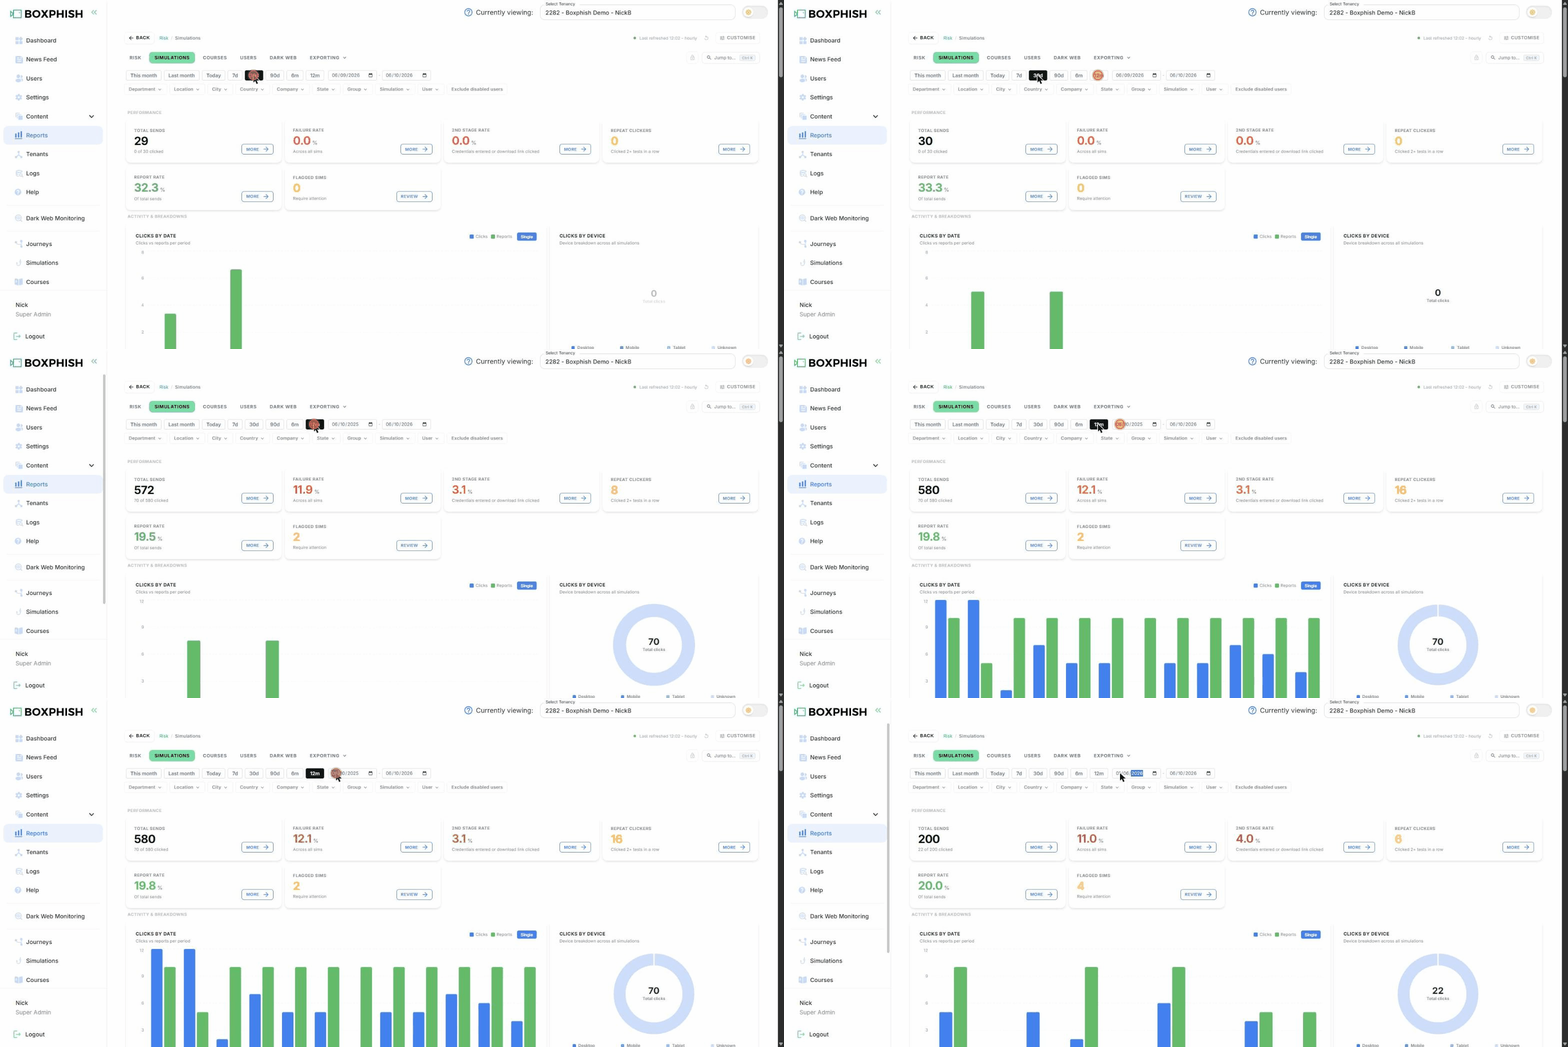
- For a custom date range
- Dropdown filters will display a list of options
- Selecting a dropdown box will display a list of items you can filter by.
- Select an option.
- Click Apply.
- Filtered data will be displayed and an item filter icon will show below the filter bar.
- Clicking Clear in a filter dropdown will remove all selections for that filter.
- To confirm clear, click Apply.
- Clicking the 'x' on the selected filter item will clear the filter.
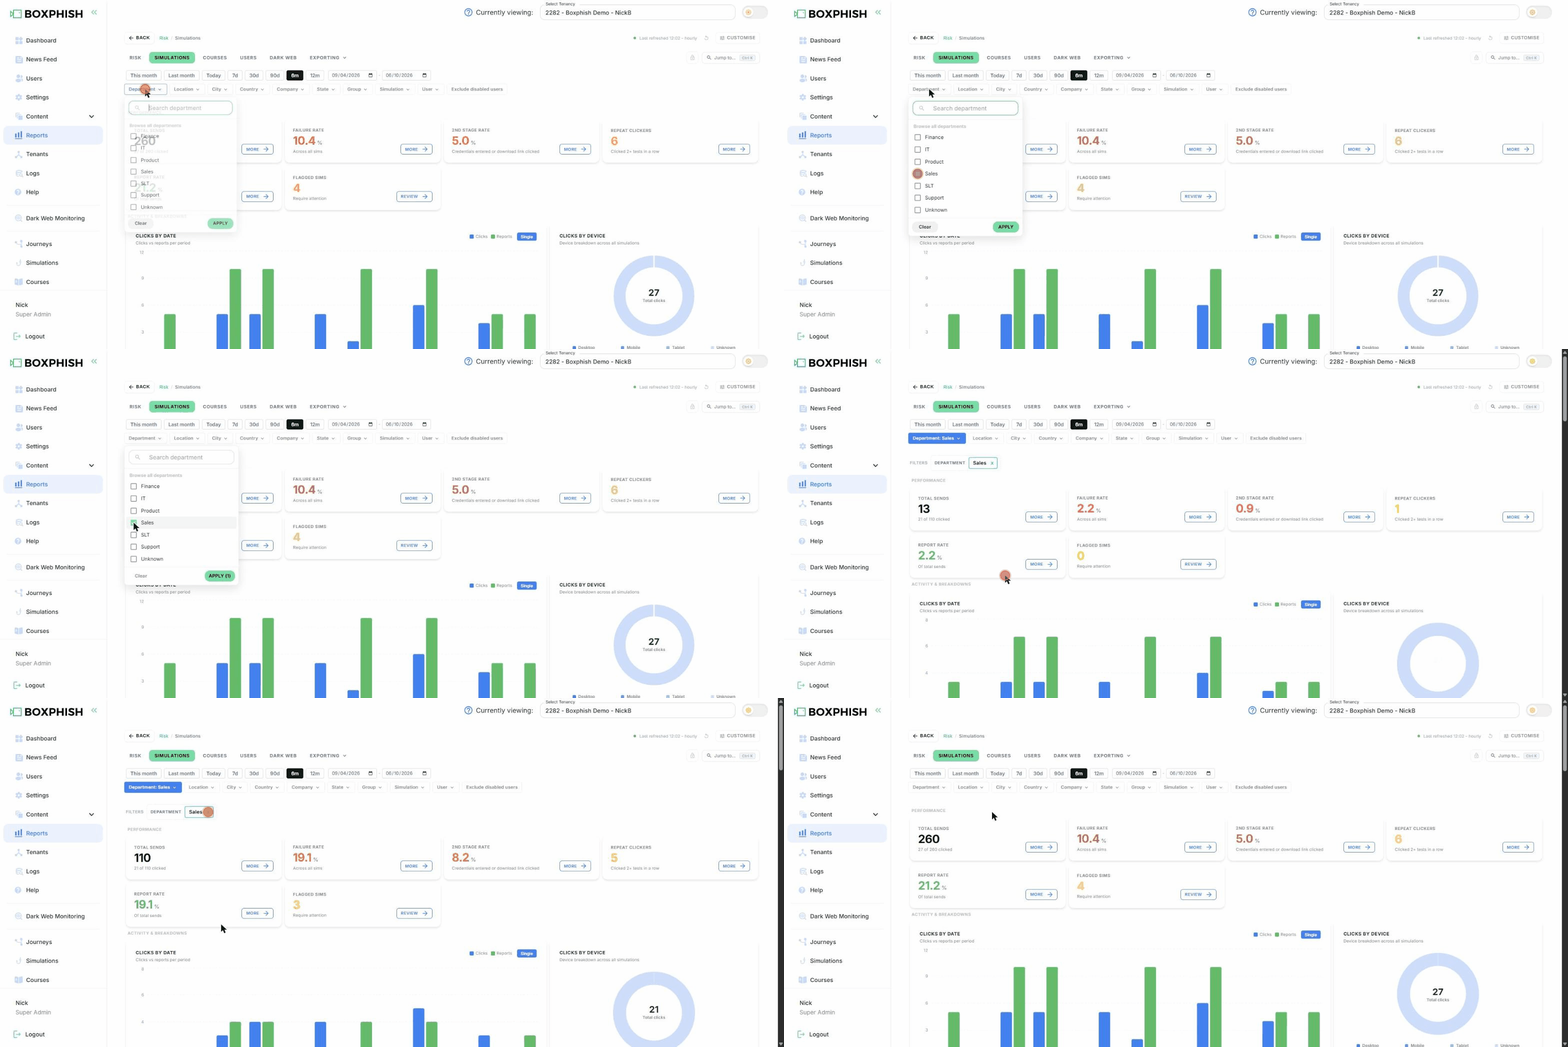
- Clicking Clear in a filter dropdown will remove all selections for that filter.
- Exclude disabled users
- Selecting this toggle button will filter out any data associated to a disabled user's account.
- Preset date filters will automatically apply
Breadcrumbs
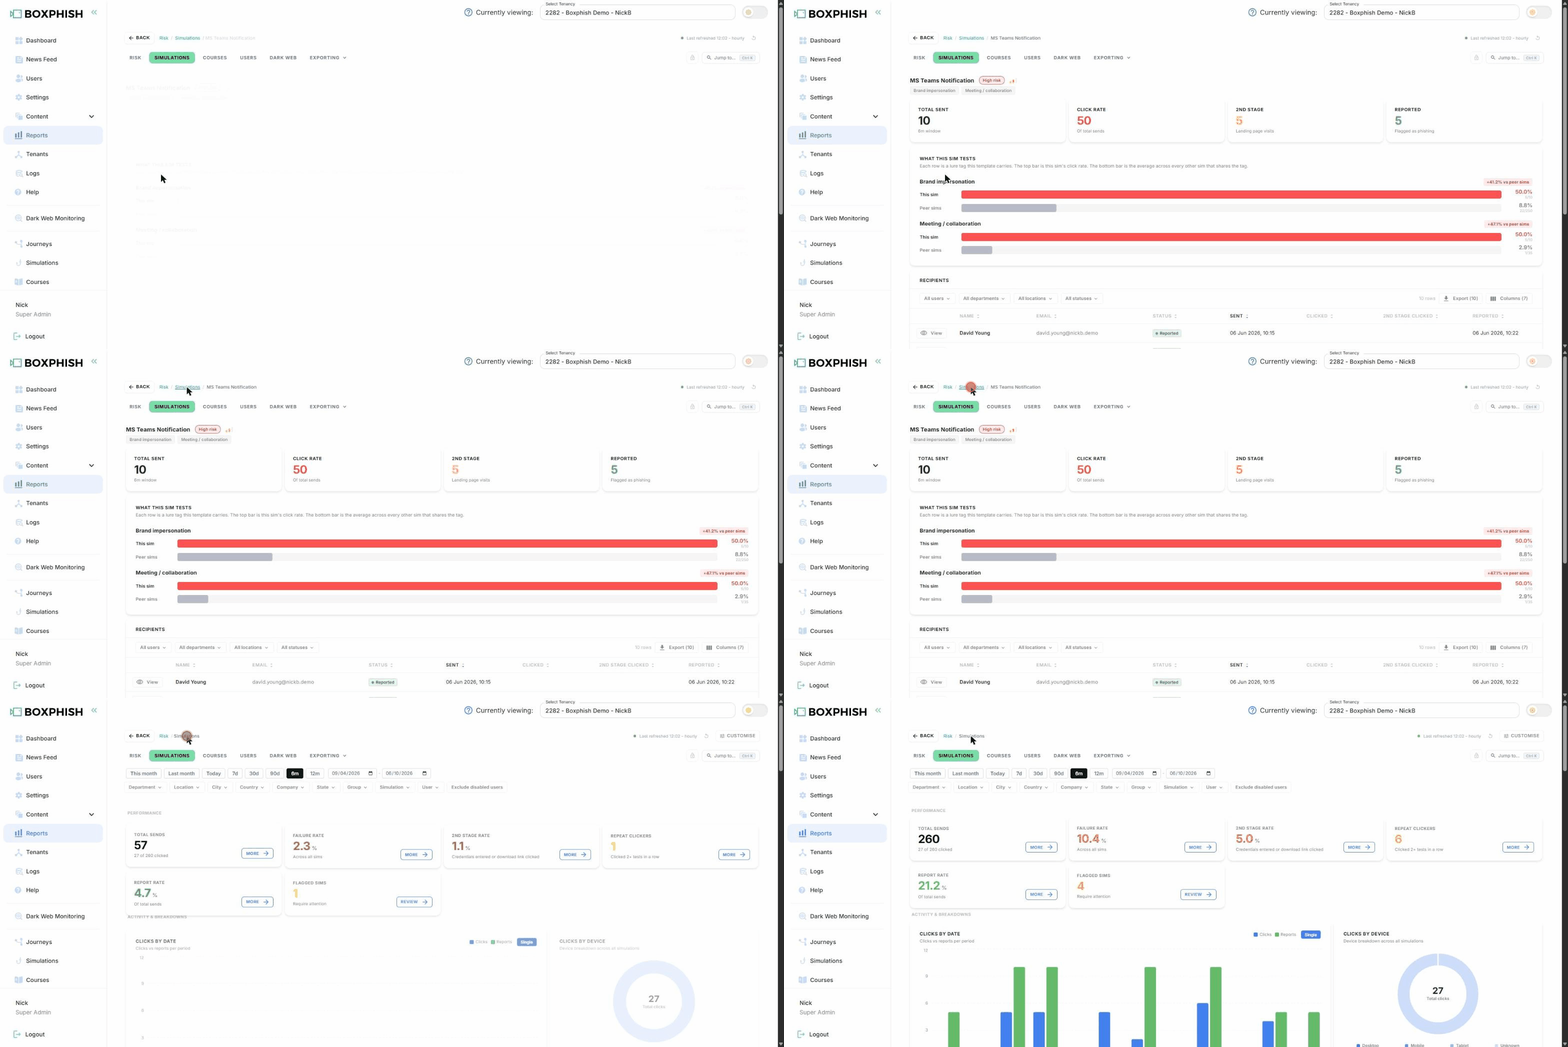
Selecting another page within reports will display breadcrumbs and a back button.
- Selecting Back or the breadcrumb will return you to the Risk page.
How did we do?
Risk Page
