User Guide
Introduction
This document will introduce the UI and the features available to Users and Administrators.
Accessing the UI
- Navigate to portal.boxphish.com
- Login using Single Sign-On via Microsoft or Google, or via Email. If you are logging in by email for the first time please follow the instructions provided under "New to Boxphish" on the login screen.
Portal Home Screen
On logging in Administrators will be presented with a screen similar to the one below, with branding and themes configured for the specific tenancy. Users will see a similar screen, with 'Your Courses' and 'Feed' shown by default along with any other features granted explicitly.

The following functions are available directly on the home screen:
- User Details - At the bottom of the left hand menu the currently logged on user is displayed along with their access level.
- Logout - At the bottom of the left hand menu is the option to log out. This is will return the user to the login screen.
- Dark Mode - In the top right is the option to switch the UI from light to dark mode.

Navigating the Menu
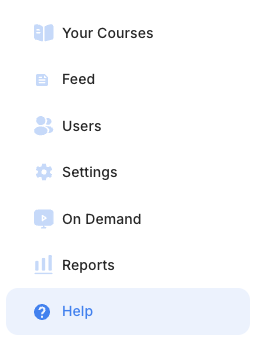
The following features are available from the left hand menu, and are fully detailed later in this document:

Menu Item | Access Level | Description |
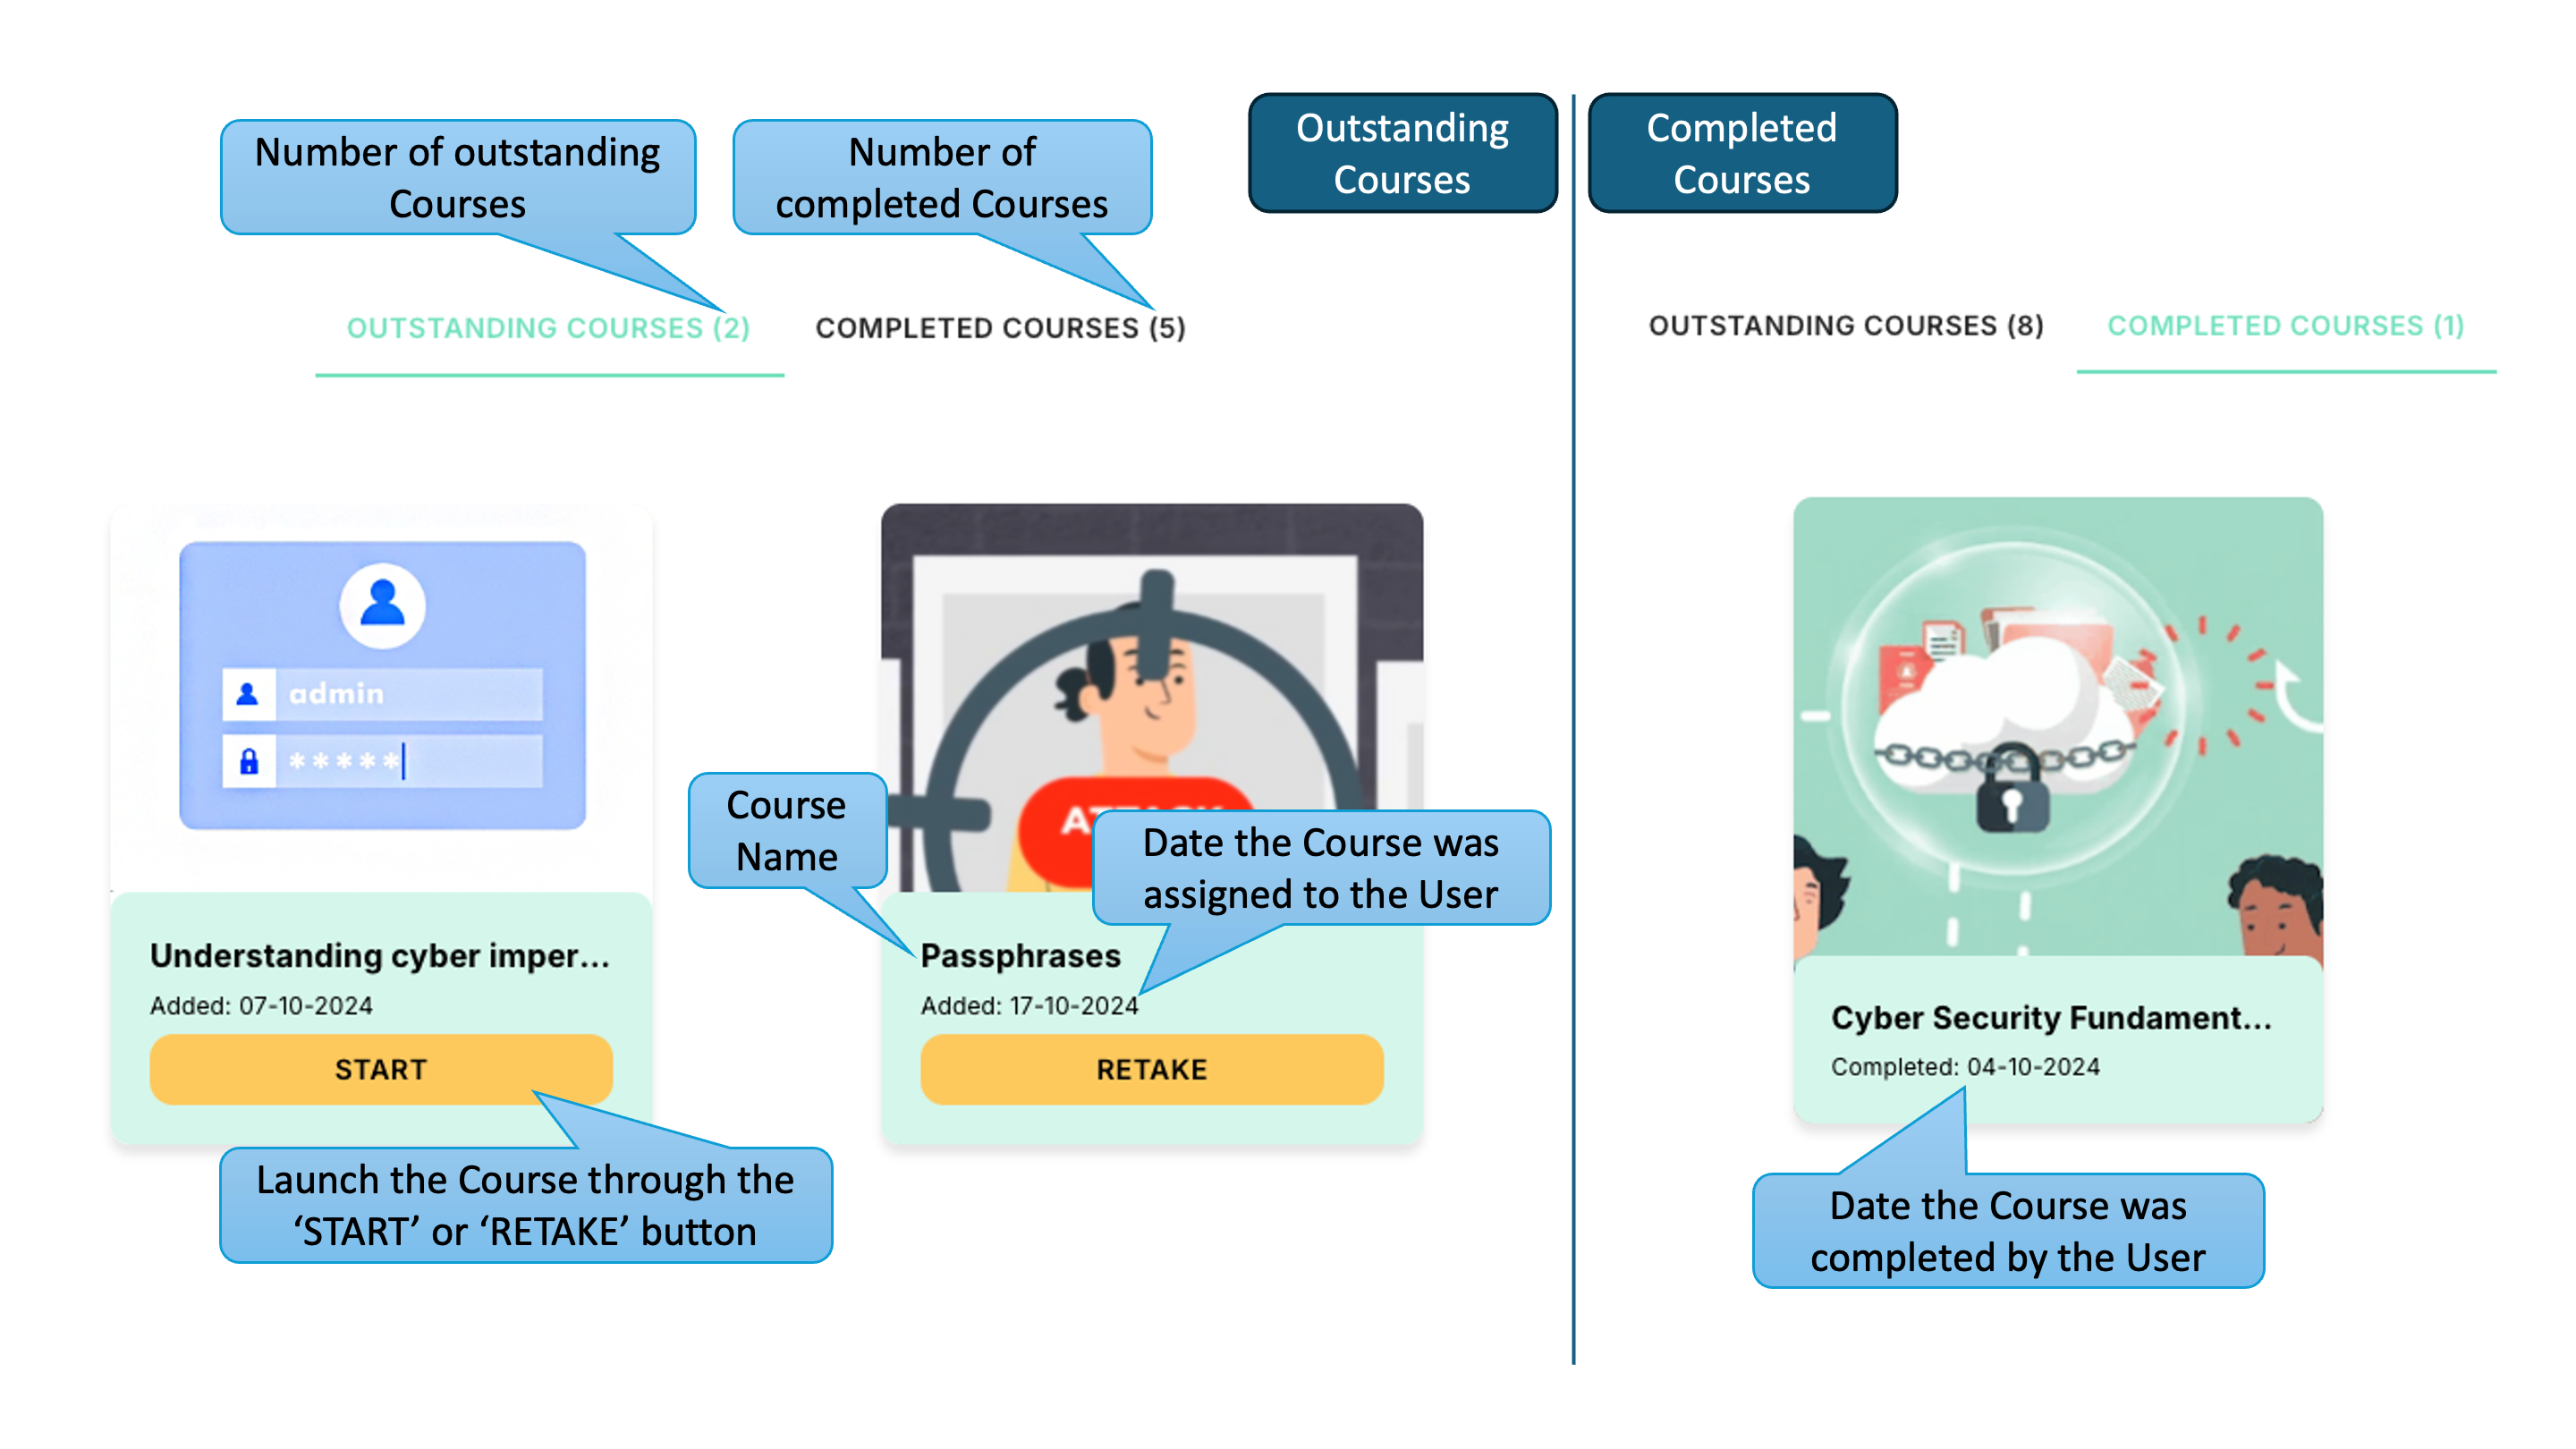
Your Courses | User | The page will show all the Training Courses that have been shared with the User, with the outstanding courses on the first tab, and completed courses on the second tab. |
Feed | User | This page shows the latest news related to IT security from various trusted providers. It will also include platform update messages for both Users and Administrators. |
Users | Administrator | This page provides all User Management functionality, including User Permissions, Manual User addition & deletion, automated User Synchronisation and User auditing. |
Settings | Administrator | This page contains all the configuration options for setting up and managing the tenancy. |
On Demand | Administrator User(Elevated) | This page allows Simulations and Training Courses to be sent to Users within the tenancy both immediately or scheduled. User access to this page can be granted by an Administrator. |
Reports | Administrator User(Elevated) | This page provides a suite of dashboards and reports that provide insight into how Users are engaging with both Simulations and Training Courses. User access to this page can be granted by an Administrator. |
Help | Administrator | This button will open the knowledge base provided detailed information on how to setup and administer the platform. |
Your Courses
Once logged in all users are presented with the 'Your Courses' page regardless of access level. This will display all outstanding courses on the first tab and all completed courses the second tab. The image below shows the page and the information contained within it.
Taking a Course
On starting a Course it will be launched within the UI and will look similar to the image below.
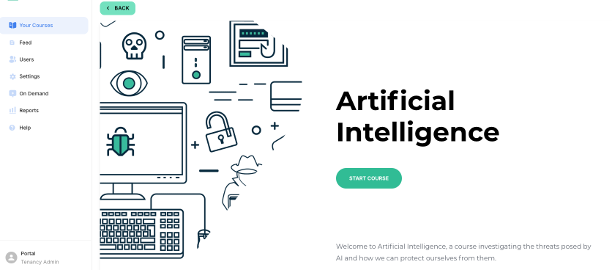
Each Course will provide the detailed steps on how to complete it within the Course itself. With each being different this is not detailed within this guide. In general, Courses will have a similar look and feel as established during onboarding discussions with the content team.
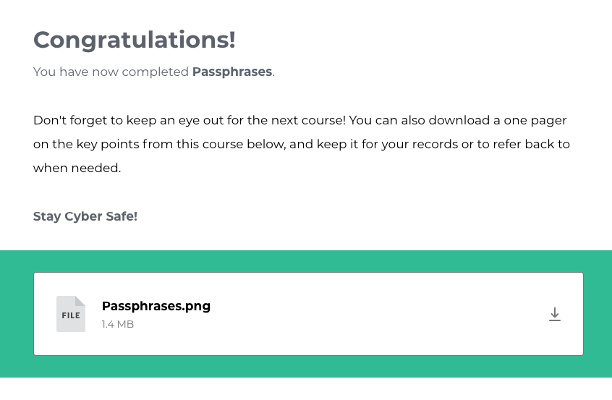
On completing a Course the user will be presented with a relevant message and provided with a downloadable infographic related to the course. An example is below.
Feed
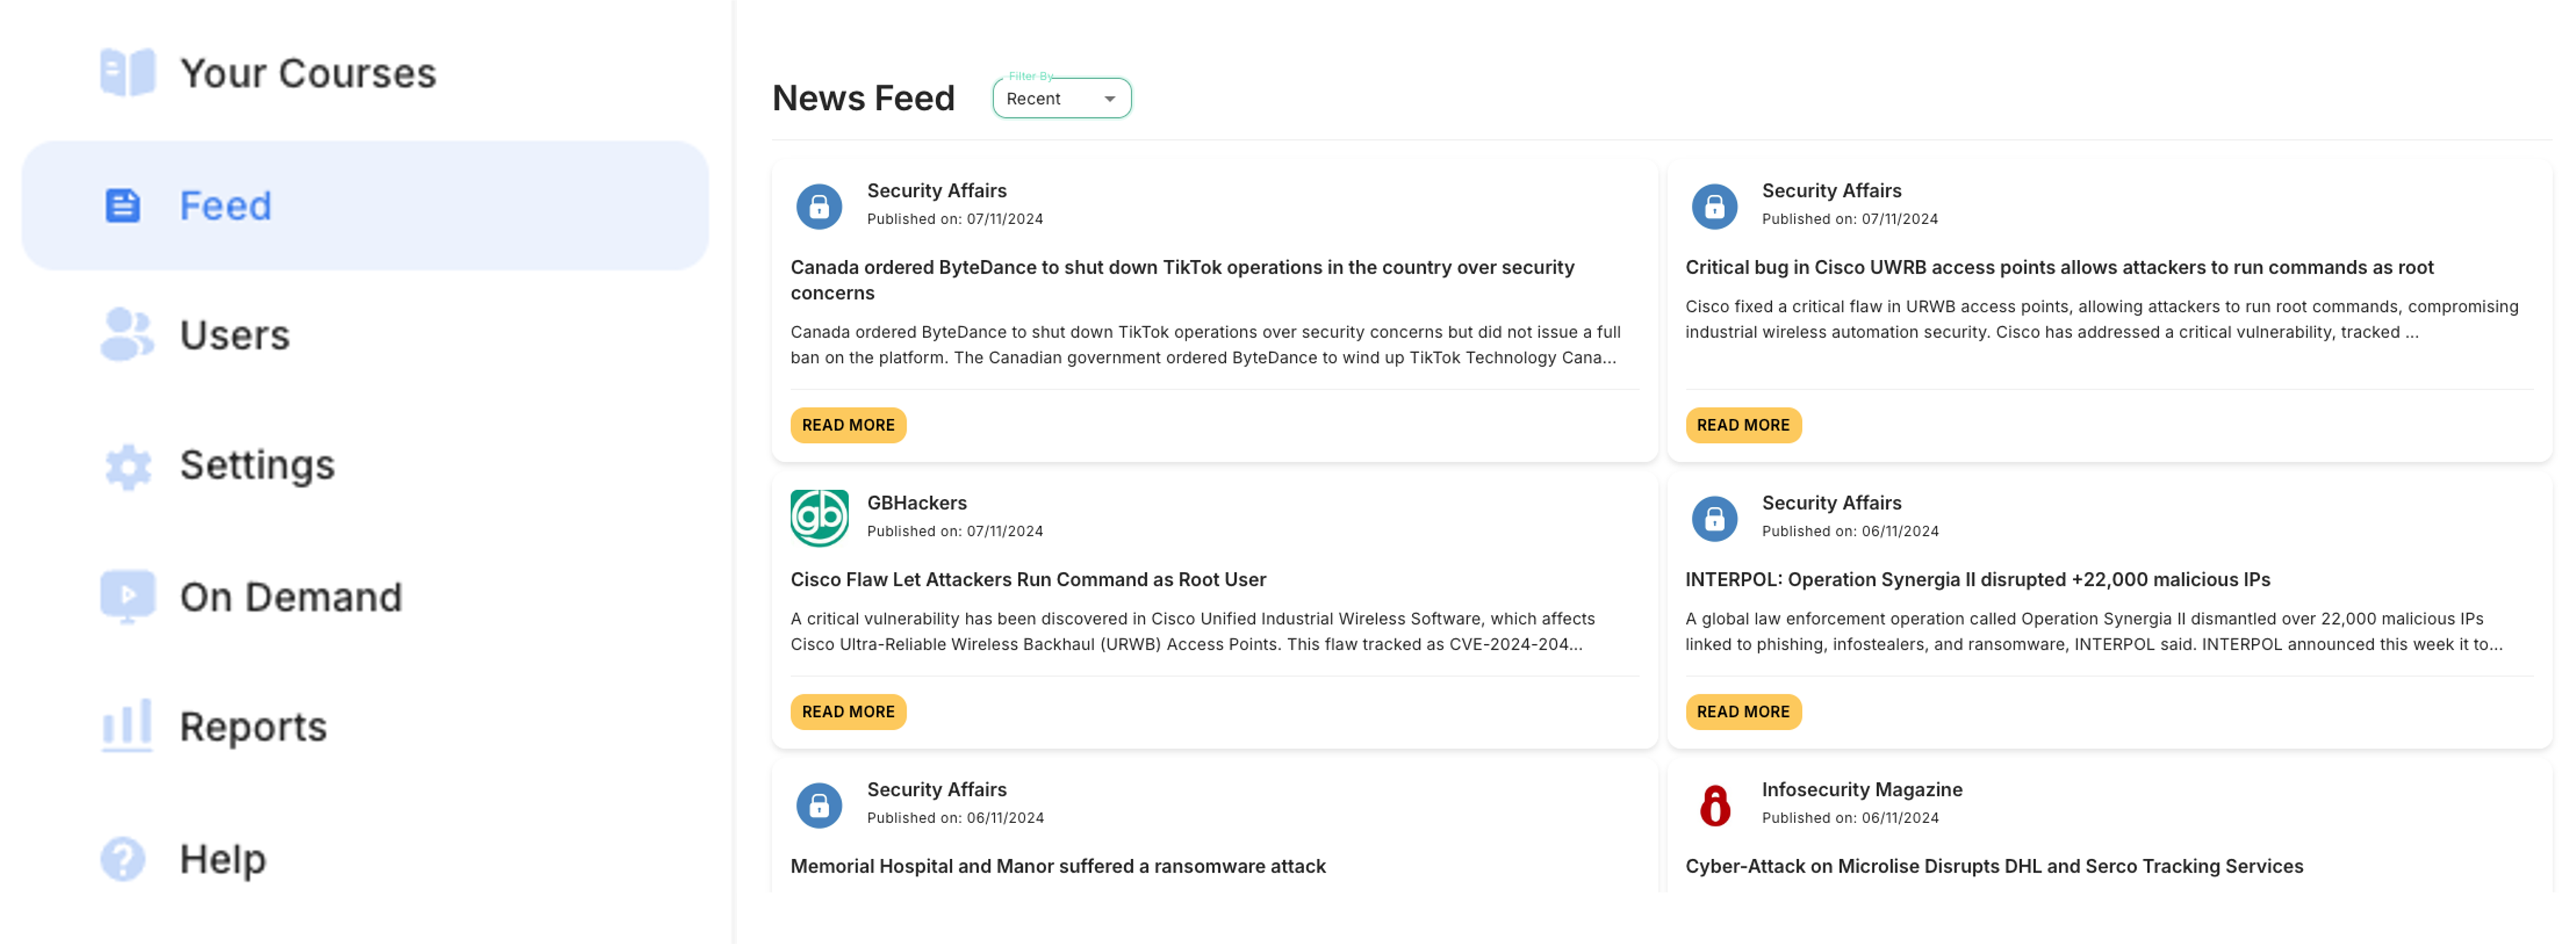
By selecting the 'Feed' option in the left hand menu the user is presented with the latest news and tips from a series of leading sources related to security awareness, such as the NCSC. The menu and some examples of the types of article are shown below. Filtering to specific sources is possible through the dropdown menu.
Users
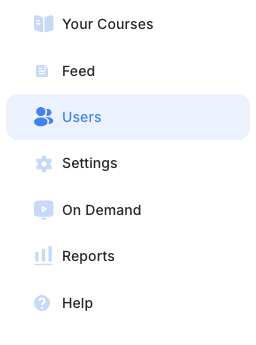
By selecting the 'Users' option in the left hand menu, shown below, an administrator can access all functionality related to the management of users in the UI. This section is split into four areas; 'User Management', 'User Sync', 'Additional Data' and 'Logs'. This section of the guide will run through each in turn.
User Management
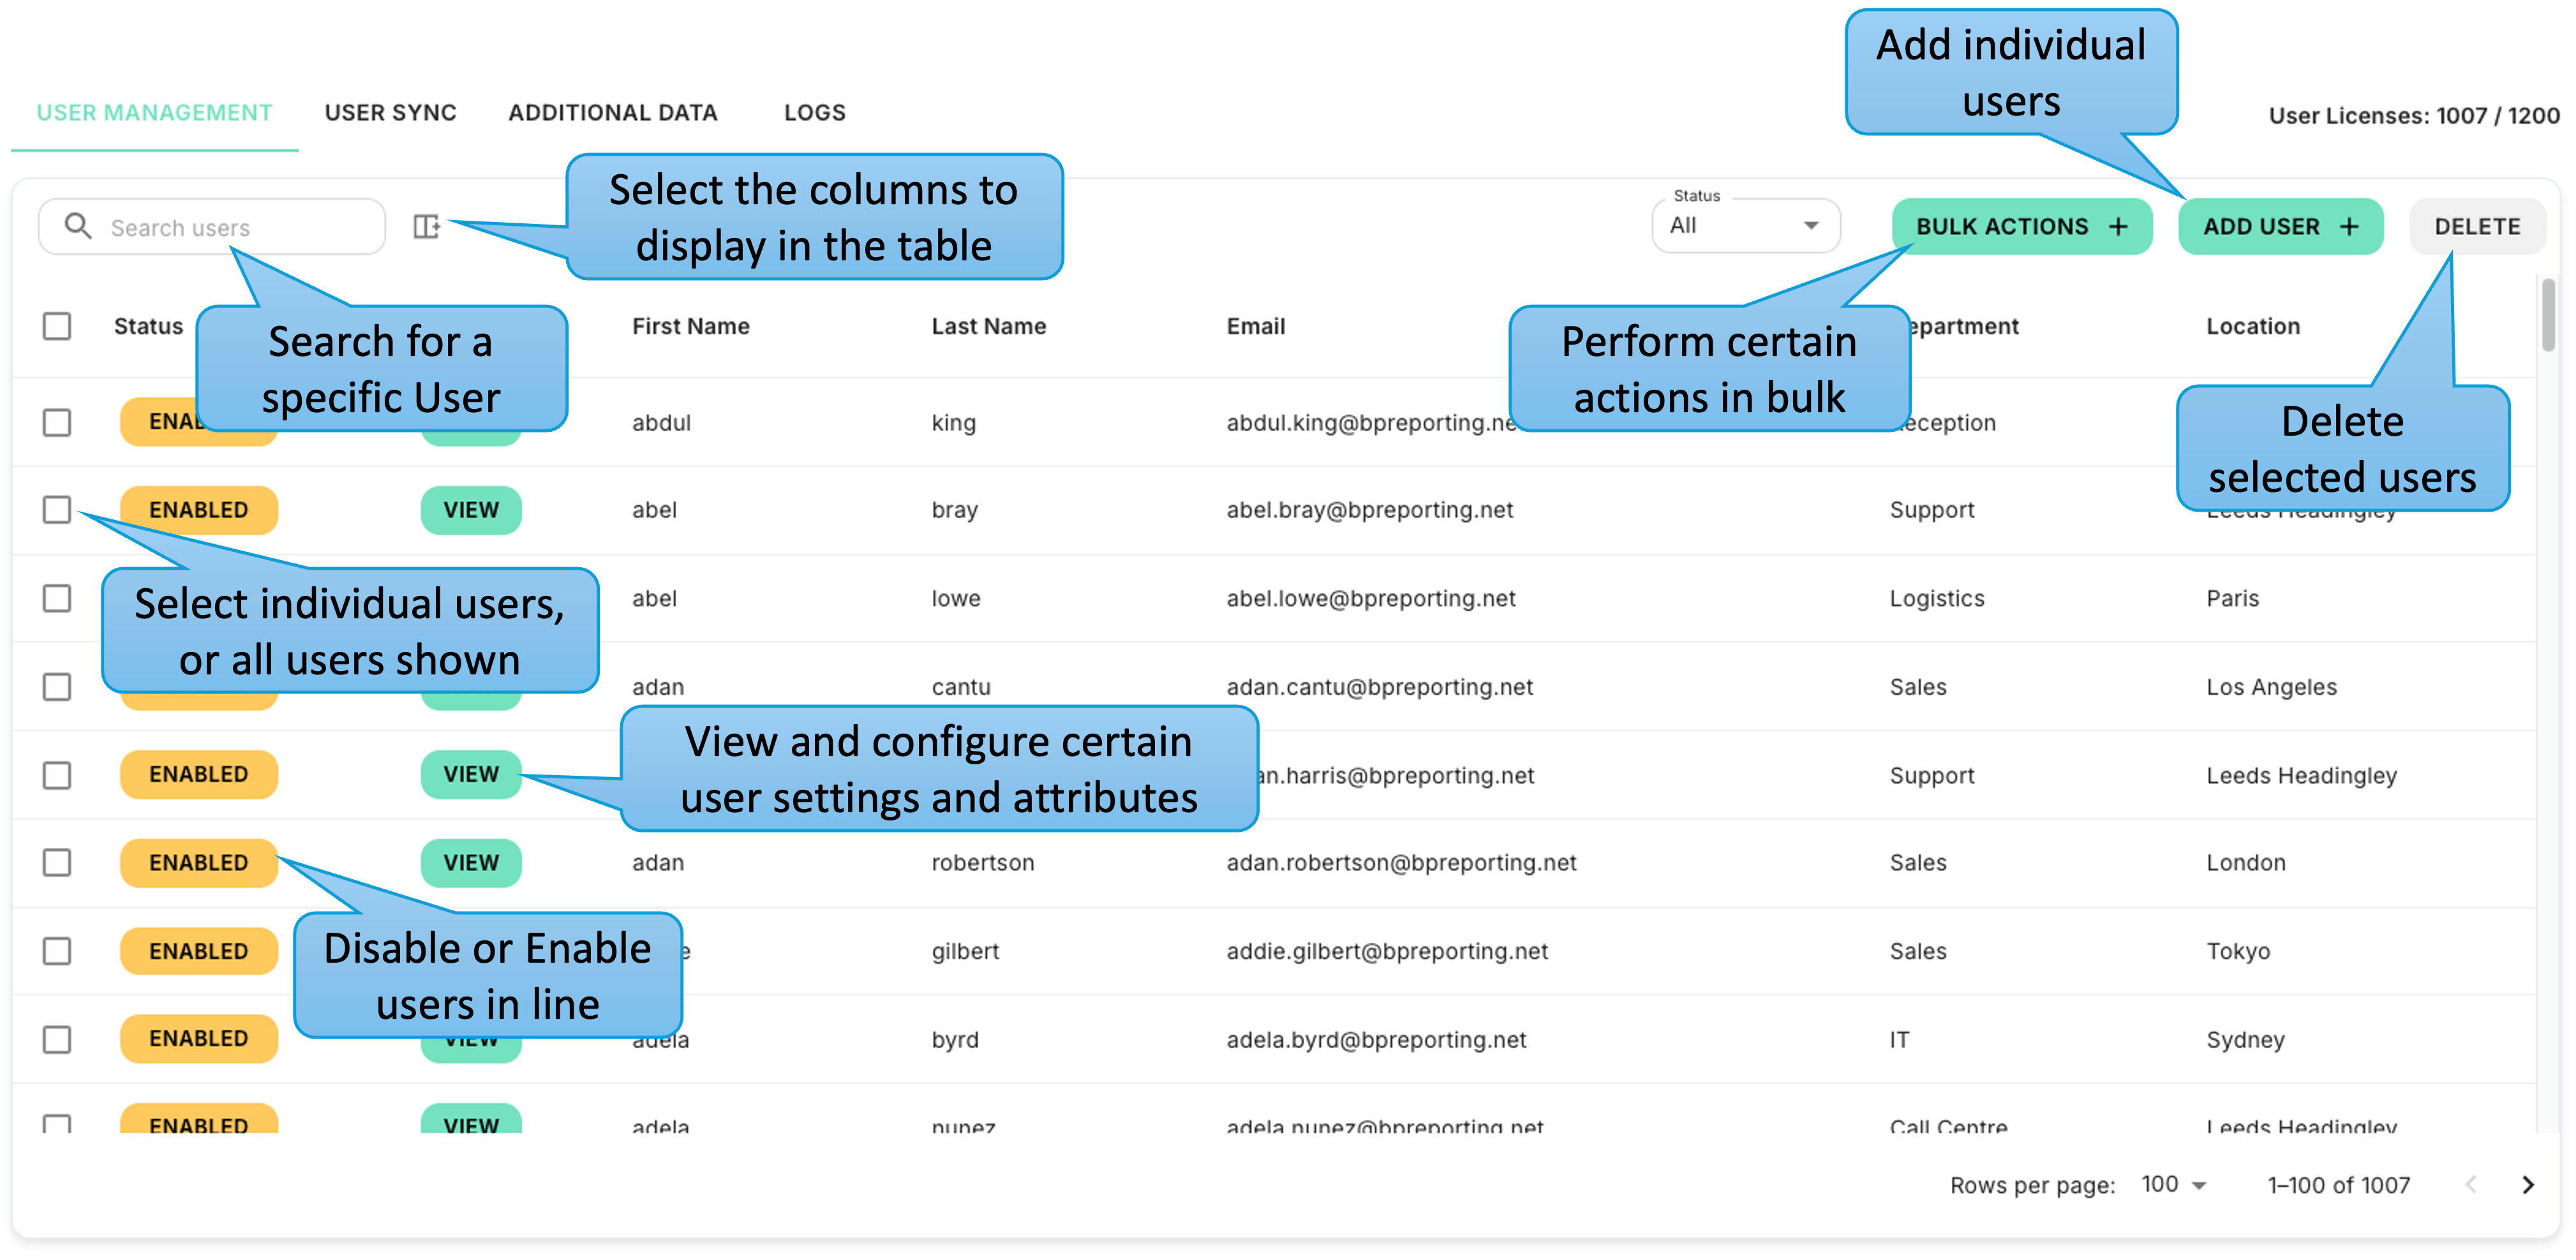
The 'User Management' page allows an administrator to view all the users in the system and their various attributes. The image below shows an example of this screen and the main functions that can be actioned from here.
Search
By typing in the search box the table is filtered down to users that match the search term in any of their 'First Name', 'Last Name' or 'Email' fields. An example of searching is shown below.

Column Selection
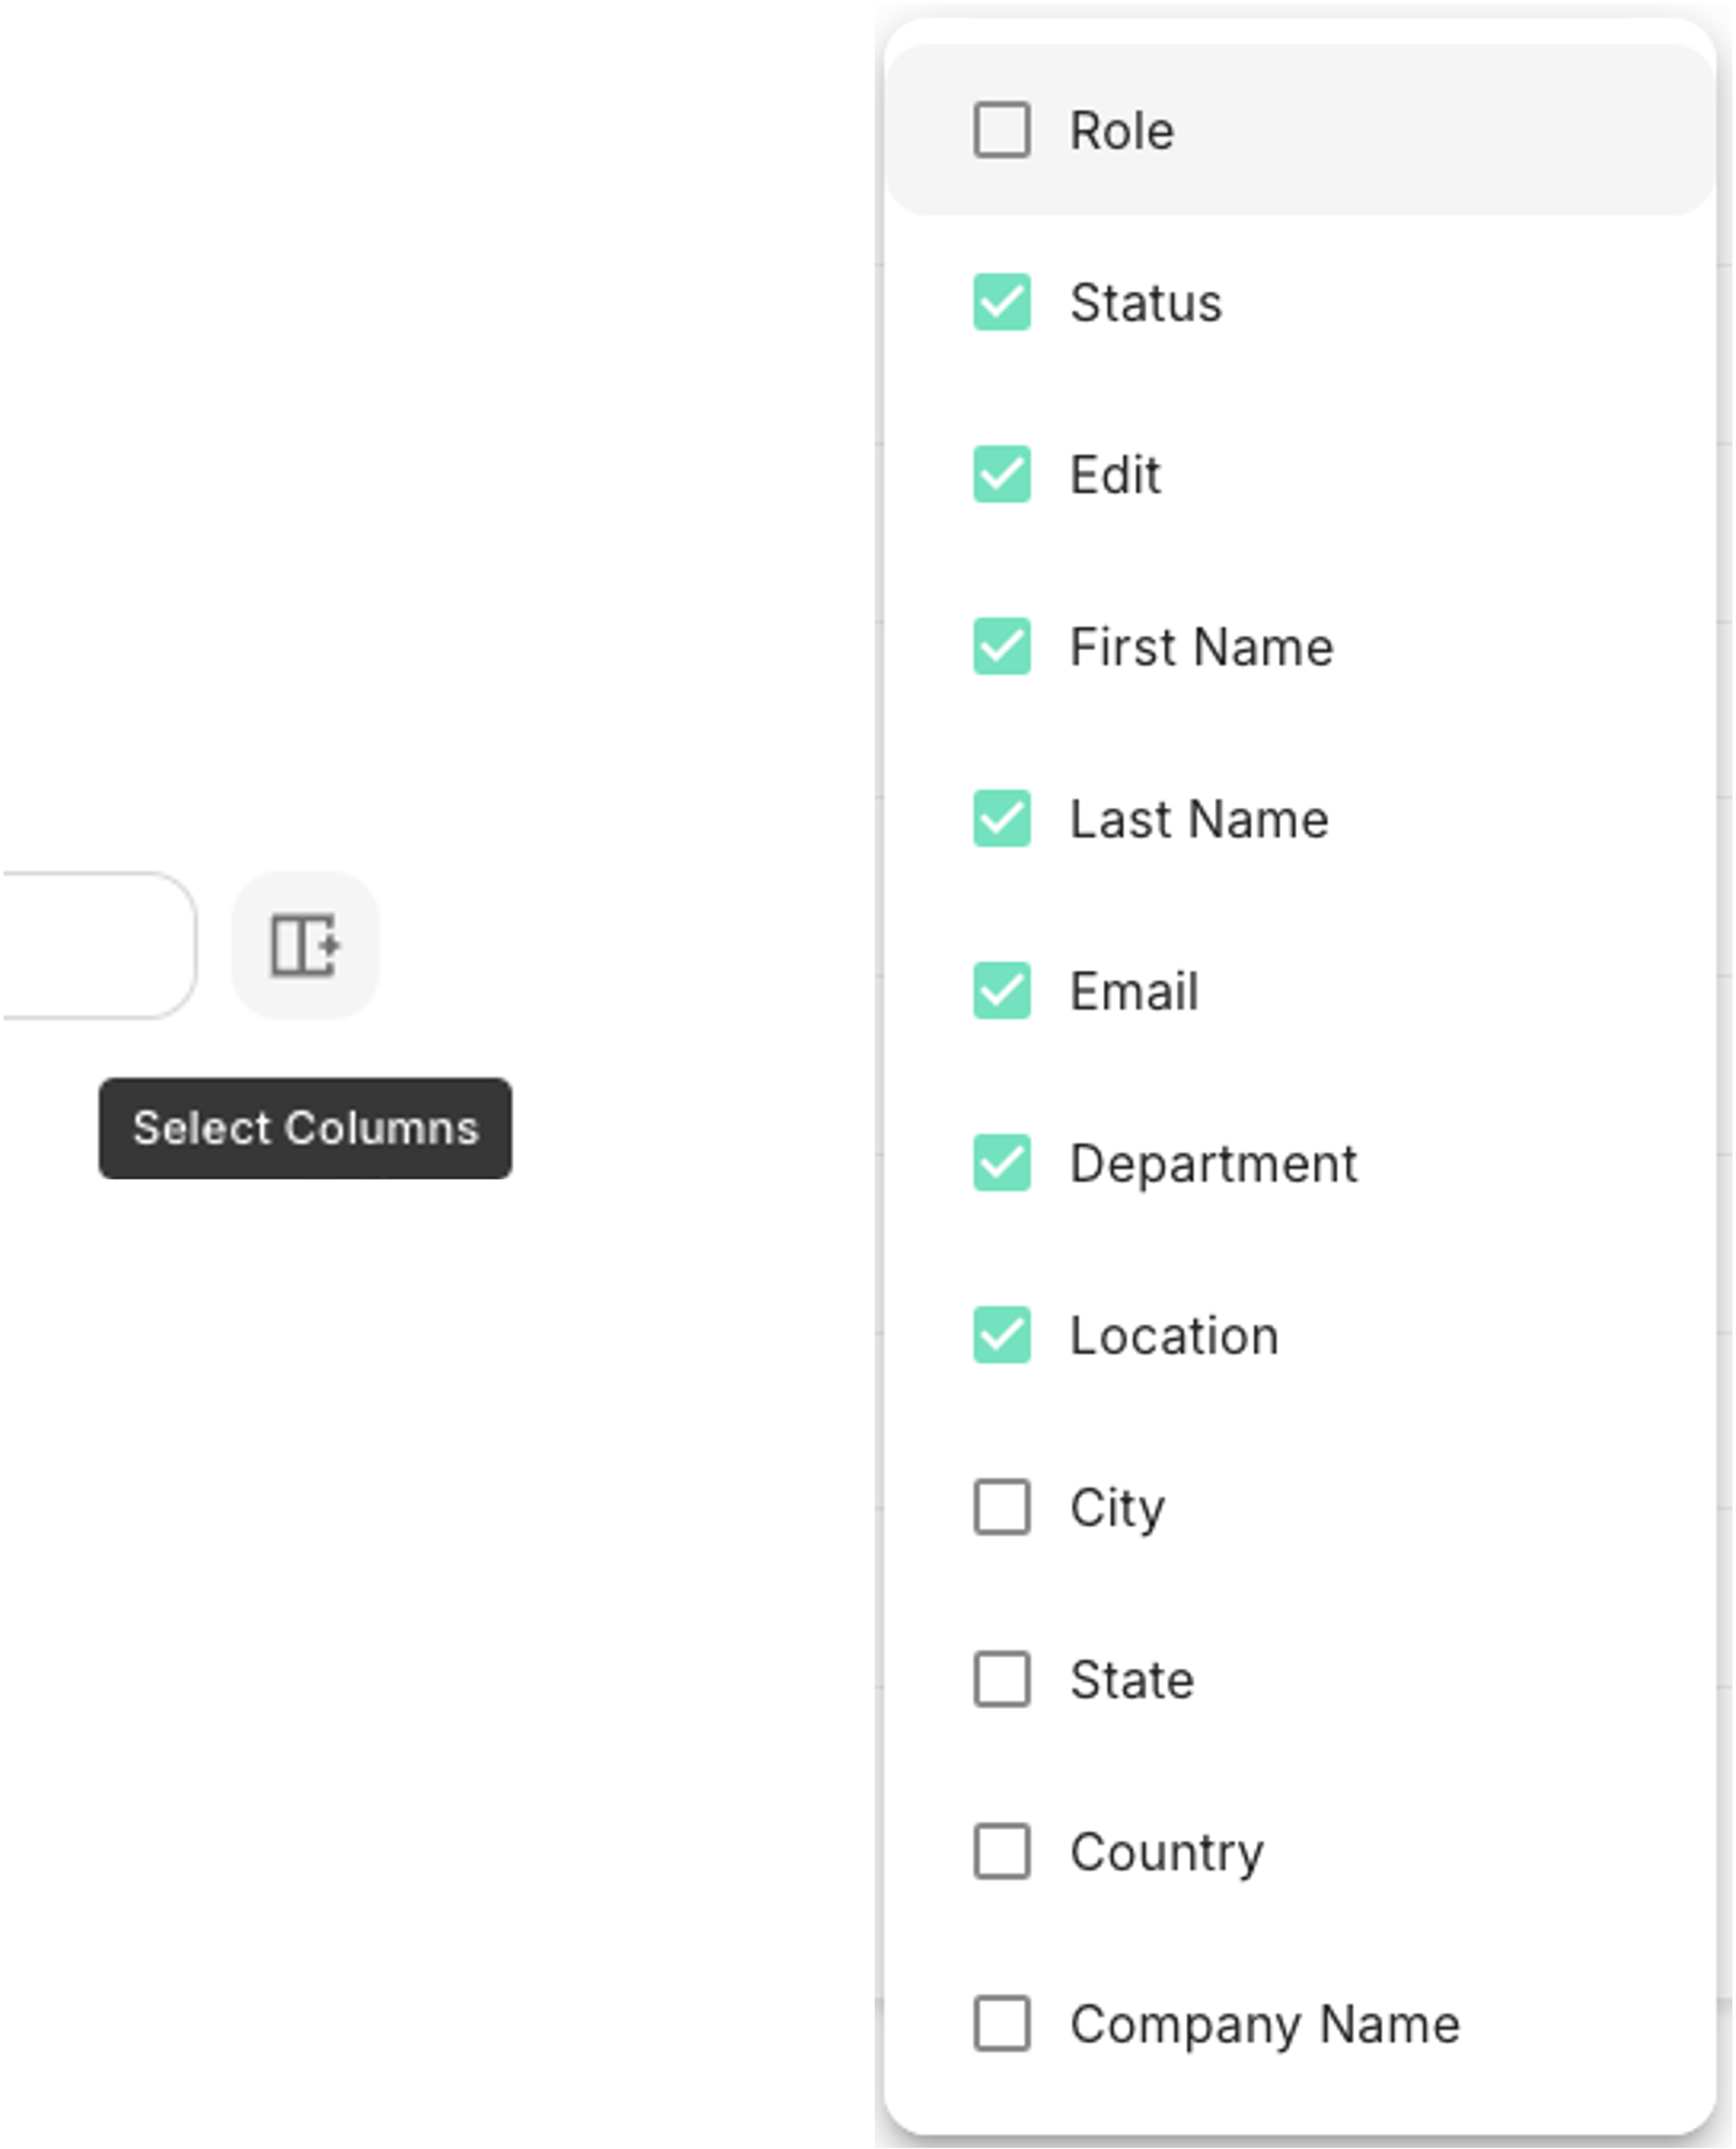
The attributes displayed for the user can be updated to by clicking on the 'Select Columns' icon, this will present the list of available attributes to show or hide in the user table.
Managing Users from the Table
It is possible for the administrator to carry out some actions directly in the table without the need to open the details of each each user. These include disabling or enabling user accounts, and deleting one or more users. Disabling/Enabling can be done by simply clicking on the 'Enabled' or 'Disabled' icon as appropriate. User deletion can be done by selecting the user(s) and clicking the now active 'Delete' button. Both options can be seen below.

Viewing and Updating Users
By clicking the 'View' button a User detail window will appear where the administrator can control individual user settings and attributes. This is split into four sections; 'User Settings', 'User Details', 'Active Journey' and 'Journey History', which will be detailed in turn.
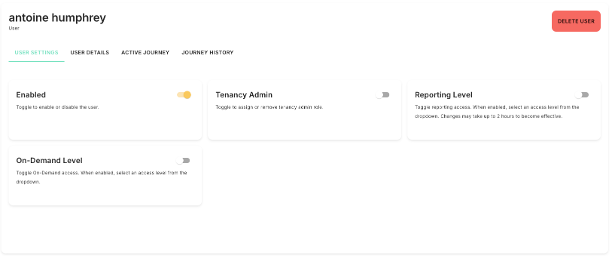
- 'User Settings' allows the administrator to control the following:
- Enabled/Disabled: Similar to the in line option above, this allows user access to be toggled on or off.
- Tenancy Admin: Elevate the user to be an administrator. When this option is enabled the 'Reporting Level' and 'On-Demand Level' are removed as an adminstrator gets these automatically.
- Reporting Level: Elevate the user permissions to provide access to the reporting functionality. This can be at the full tenancy, or restricted to their department or location. This is particular useful where manager's need access to view their team's statistics, but have no need for administration access.
- On-Demand Level: Elevate the user permissions to provide access to the on-demand functionality. This can be at the full tenancy, or restricted to their department or location. This allows managers to control the Course and Simulation sends to their team, without been granted full administration access.
- Delete User: Allows the administrator to delete the user.
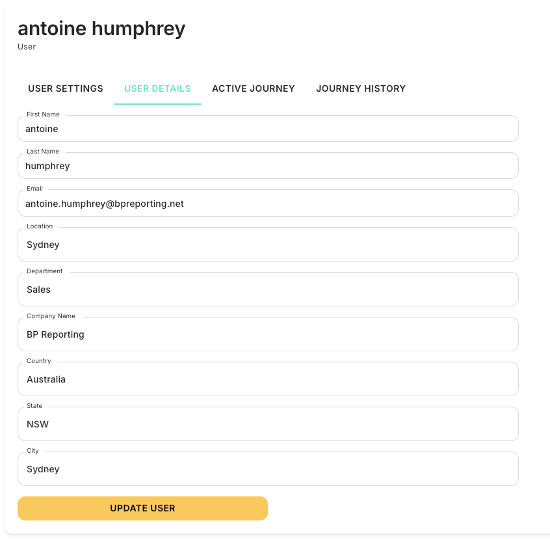
- 'User Details' allows the administrator to view and update the user attributes stored for a user.
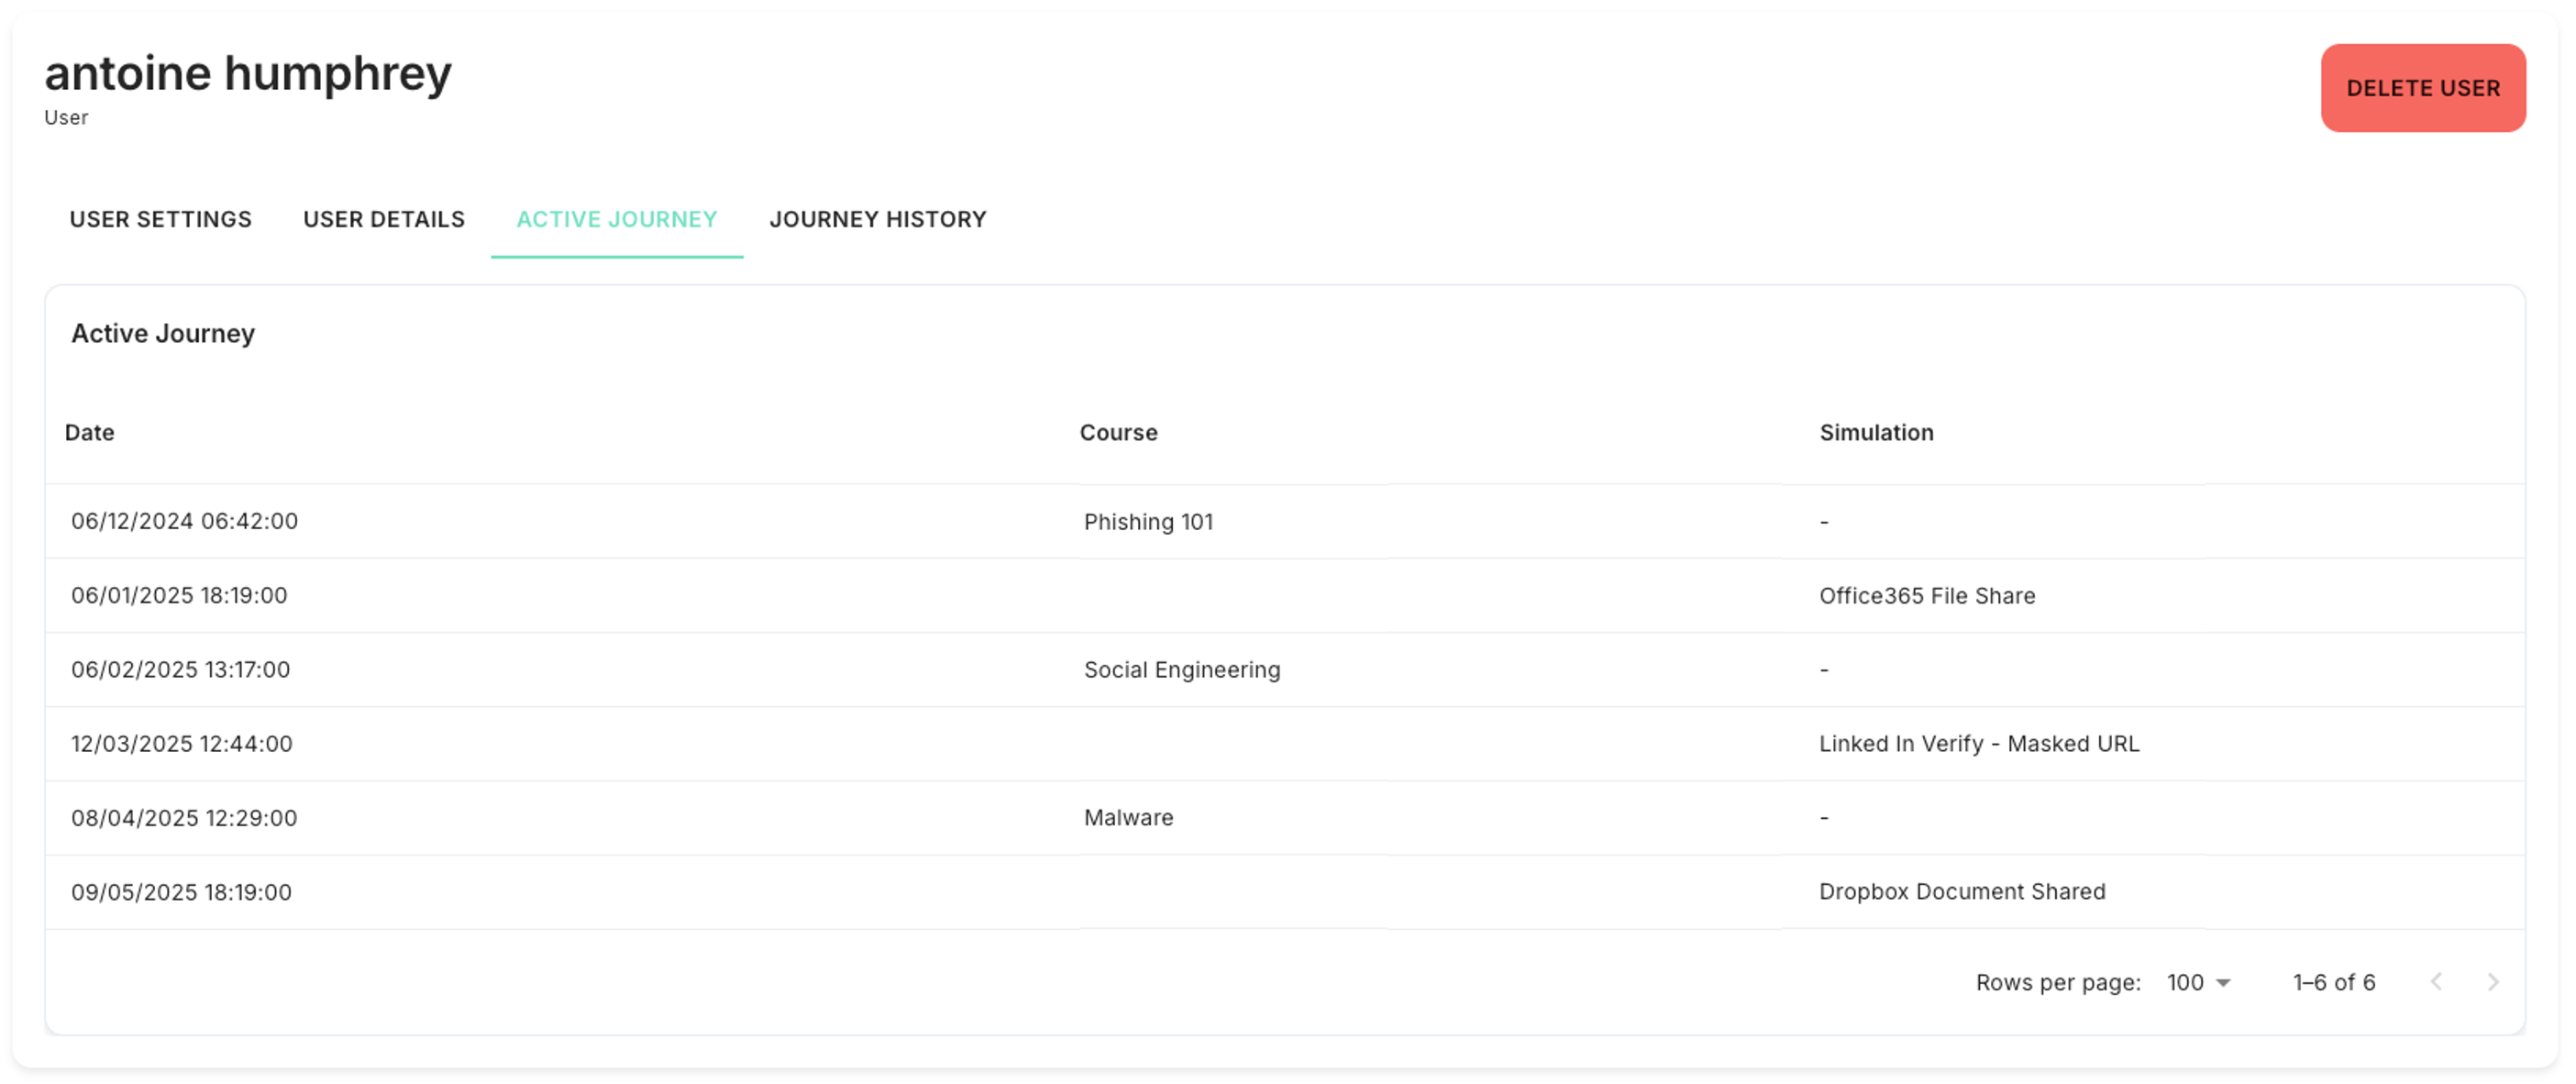
- 'Active Journey' displays the courses and simulations that are due to be sent to the user in future.
- 'Journey History' displays the courses and simulations that have been sent to the user over time.

Adding a User Manually
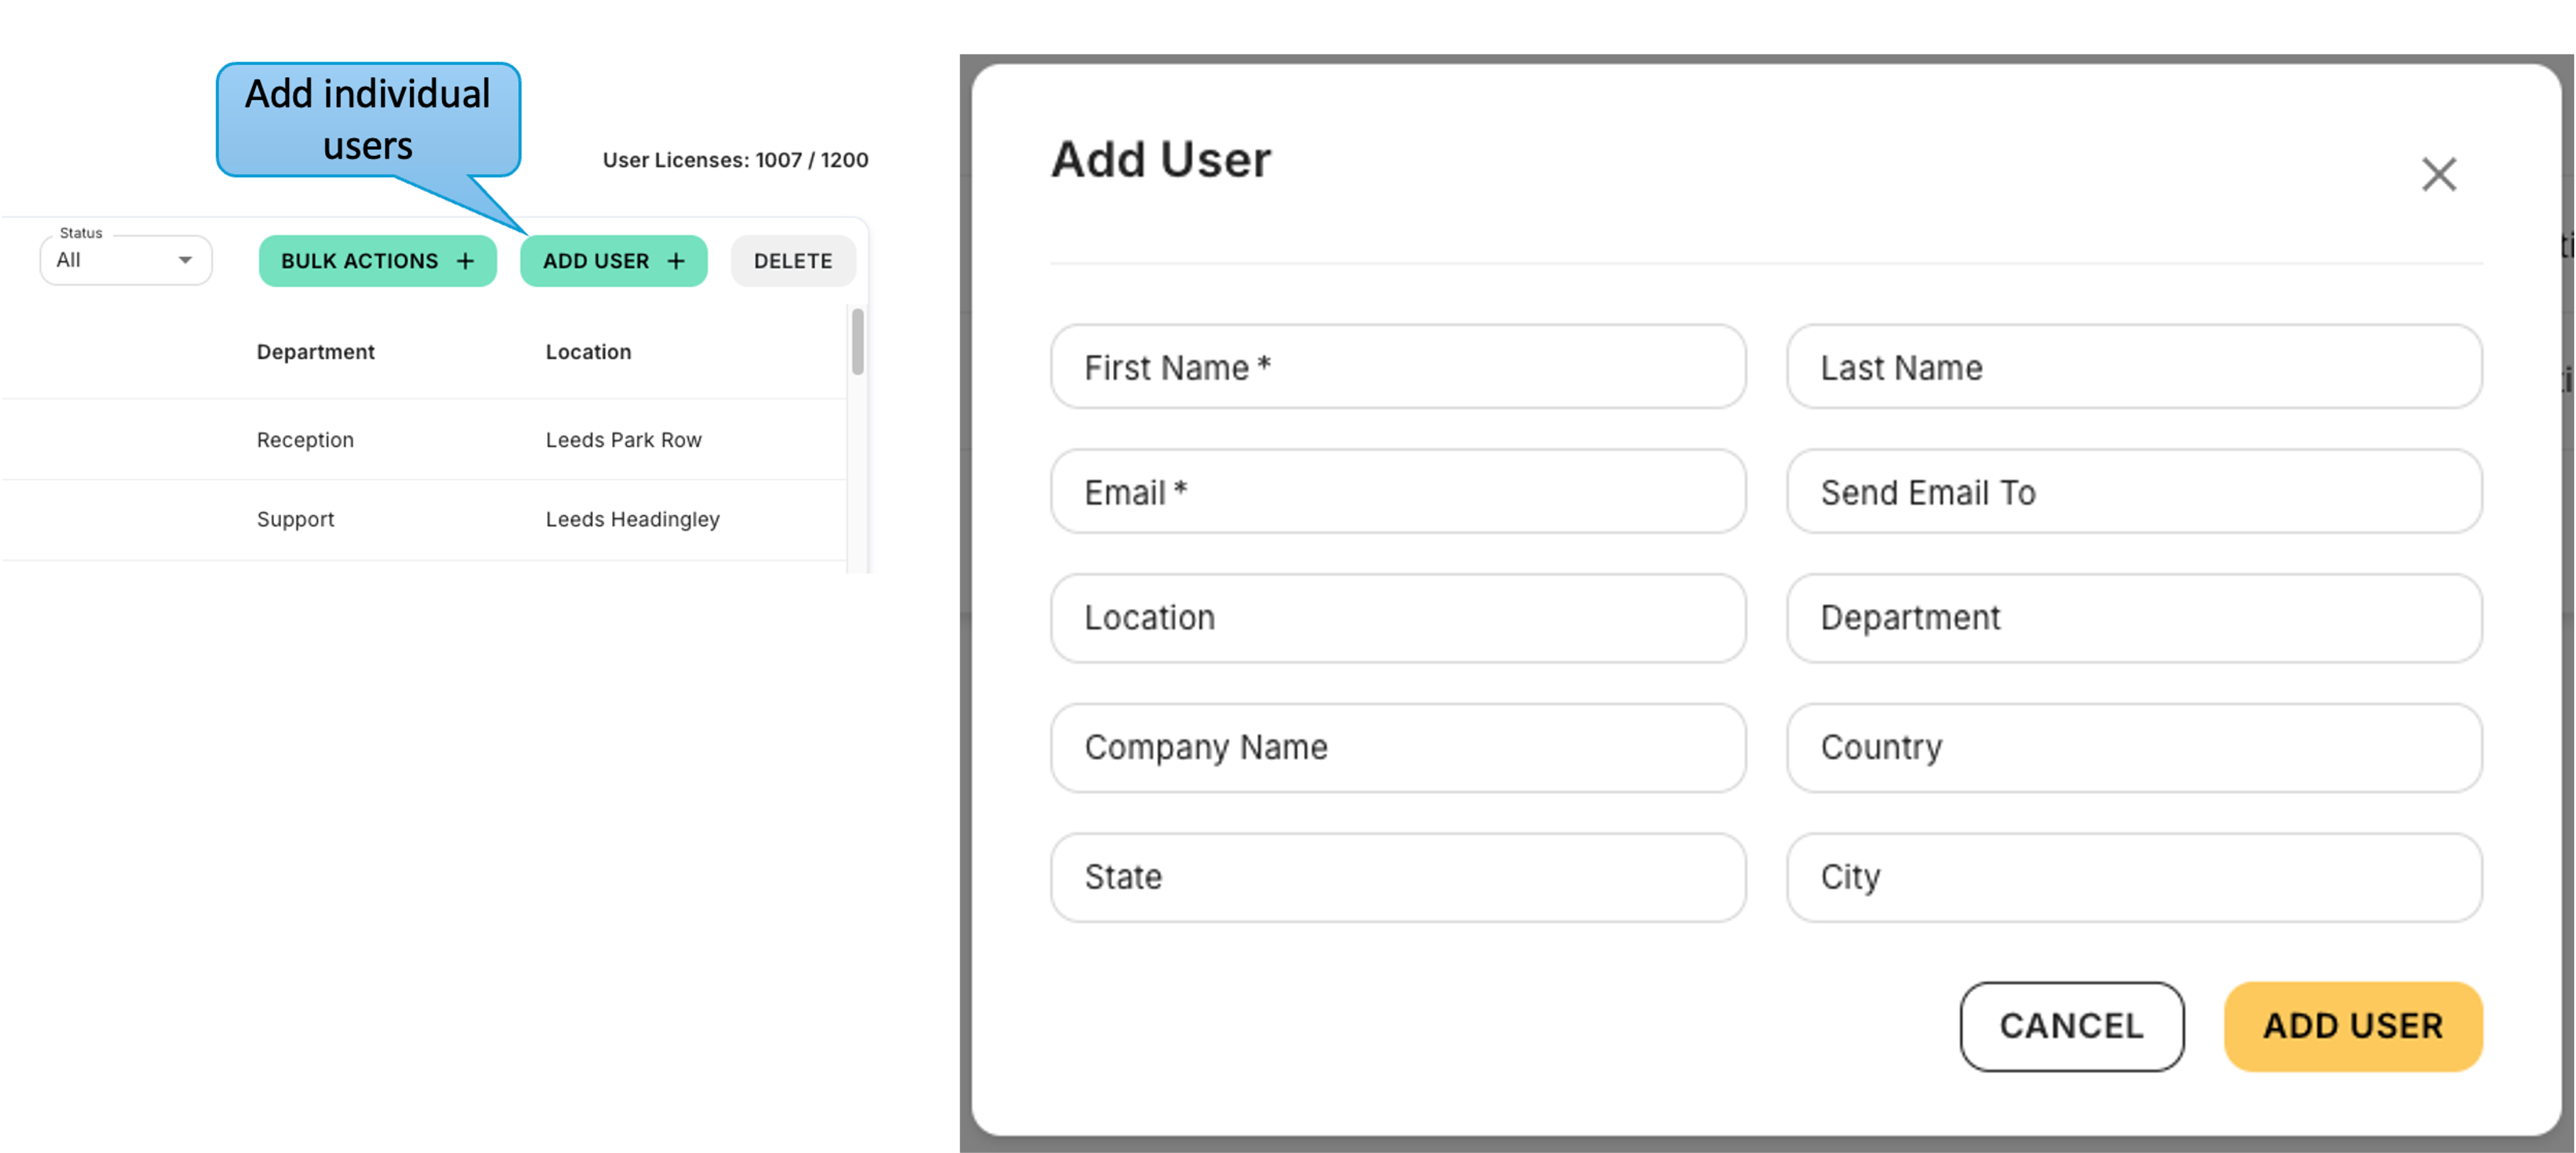
It is possible for an administrator to create a user manually by clicking the 'Add User +' button. The administrator must provide a valid email and the user will be prompted to create a password on their first login. The additional attributes can be added as part of the user creation, or later through the user management table as detailed earlier in this guide.
Bulk User Actions
An administrator can perform certain repetitive user management task by clicking the 'Bulk Actions +' button. The following is supported:
- Export Active Users: Provides a download of all enabled users in a CSV format.
- Export All Users: Provides a download of all enabled and disabled users in a CSV format.
- Send Reminders: Sends a reminder to any user that has outstanding courses.
- Add Using CSV: Supports the creation of multiple users via a CSV file. A template can be downloaded from the UI when selecting this option.
- Delete Using CSV: Supports the deletion of multiple users via a CSV file. A template can be downloaded from the UI when selecting this option.

User Sync
The 'User Sync' tab will allow administrators to connect the UI to the appropriate Microsoft or Google user management system and maintain user accounts automatically. The image below shows the this tab with no connection to a user management system.

If the a User Management system is already connected the banner will appear as below, with an icon to show if it is M365 or Google that is connected. It will also show if the connection has failed. In order to change the 'User Sync' setup, clicking the 'Reconfigure' option will allow an update to the full configuration to be made.

On clicking 'Reconfigure' the same steps as 'Connect' should be followed, as detailed below.
On clicking 'Connect' the user can choose from either Google or Microsoft, with the steps slightly different for each. The following section will detail each in turn.
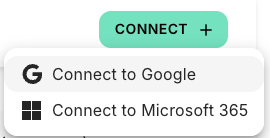
Connecting to Google
On selecting 'Connect to Google' the user will be taken to a new browser window and asked for their Google credentials. Once logged in the screen below will be presented to the user and must be accepted for the user sync to run. This will grant it read-only access to the Organisational Units needed.
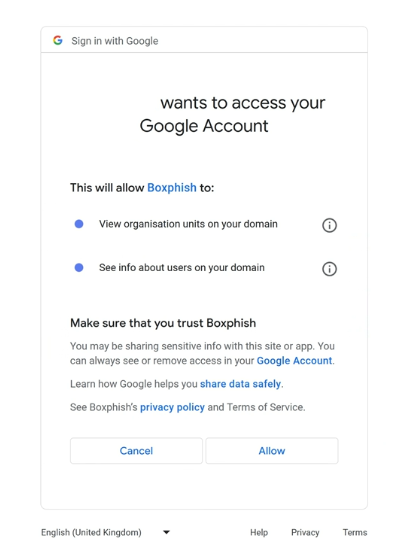
On accepting, the application will start importing the Organisational Units, whilst this runs a progress bar will be displayed.
Connecting to Microsoft
On selecting 'Connect to Microsoft 365' the user will be taken to a new browser window and asked for their Microsoft credentials. Once logged in the screen below will be presented to the user and must be accepted for the user sync to run. This will install an application in the Microsoft tenant and grant it read-only access to the User Groups and Profiles needed.
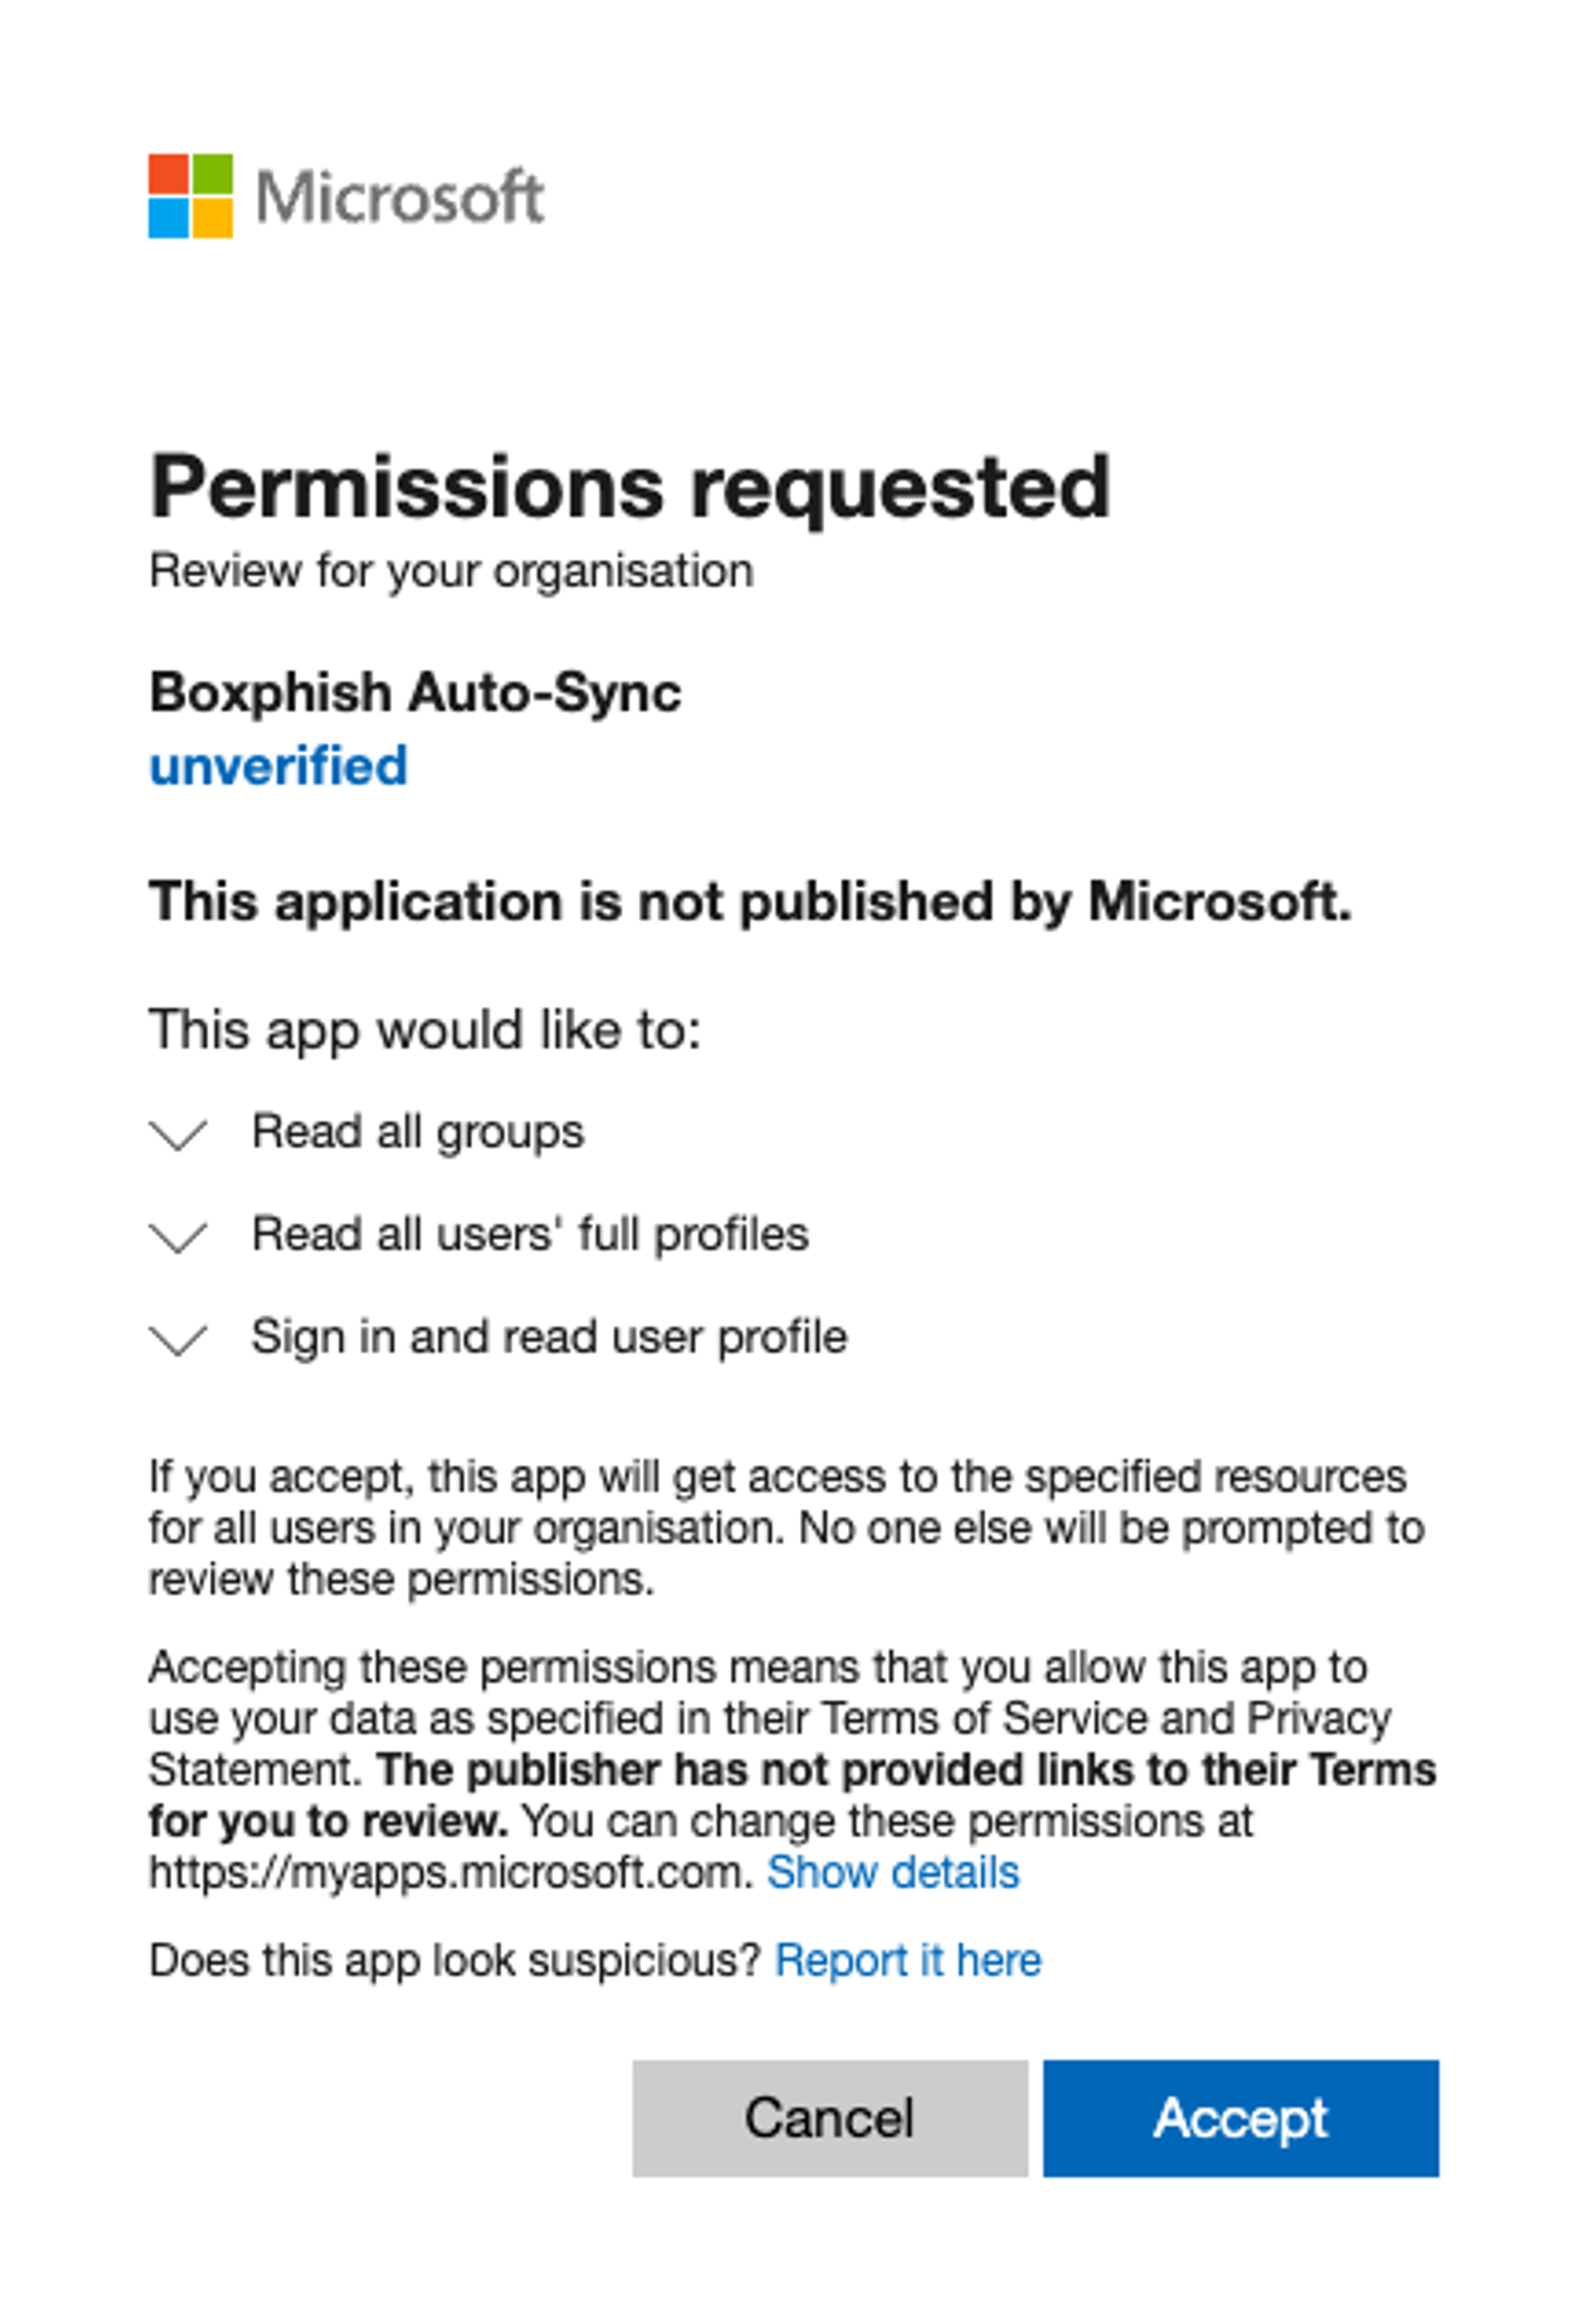
On accepting, the application will be installed and start importing the User Groups, whilst this runs a progress bar will be displayed.
Selecting Groups and Auto Sync
Once the import of the Organisational Units or User Groups has completed the administrator will be presented with the screen below to select the groups to sync with. This can be run as a one-off process, or configured to run automatically every night by ticking the 'Auto Sync' checkbox next to the 'Import Groups' button.
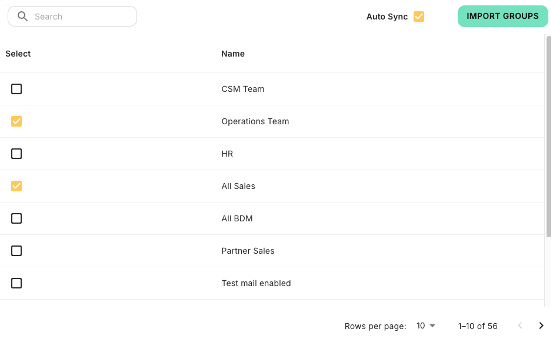
On clicking the 'Import Groups' button all users assigned to the groups selected will be added to the application and granted user access. With the auto-sync enabled users will also be deleted when removed from the group when the sync next runs.
Administering the User Sync
Once connected and under normal operation the 'User Sync' tab will present a screen similar to the one shown below. From here the administrator can see details of how the sync is configured and which groups are connected.
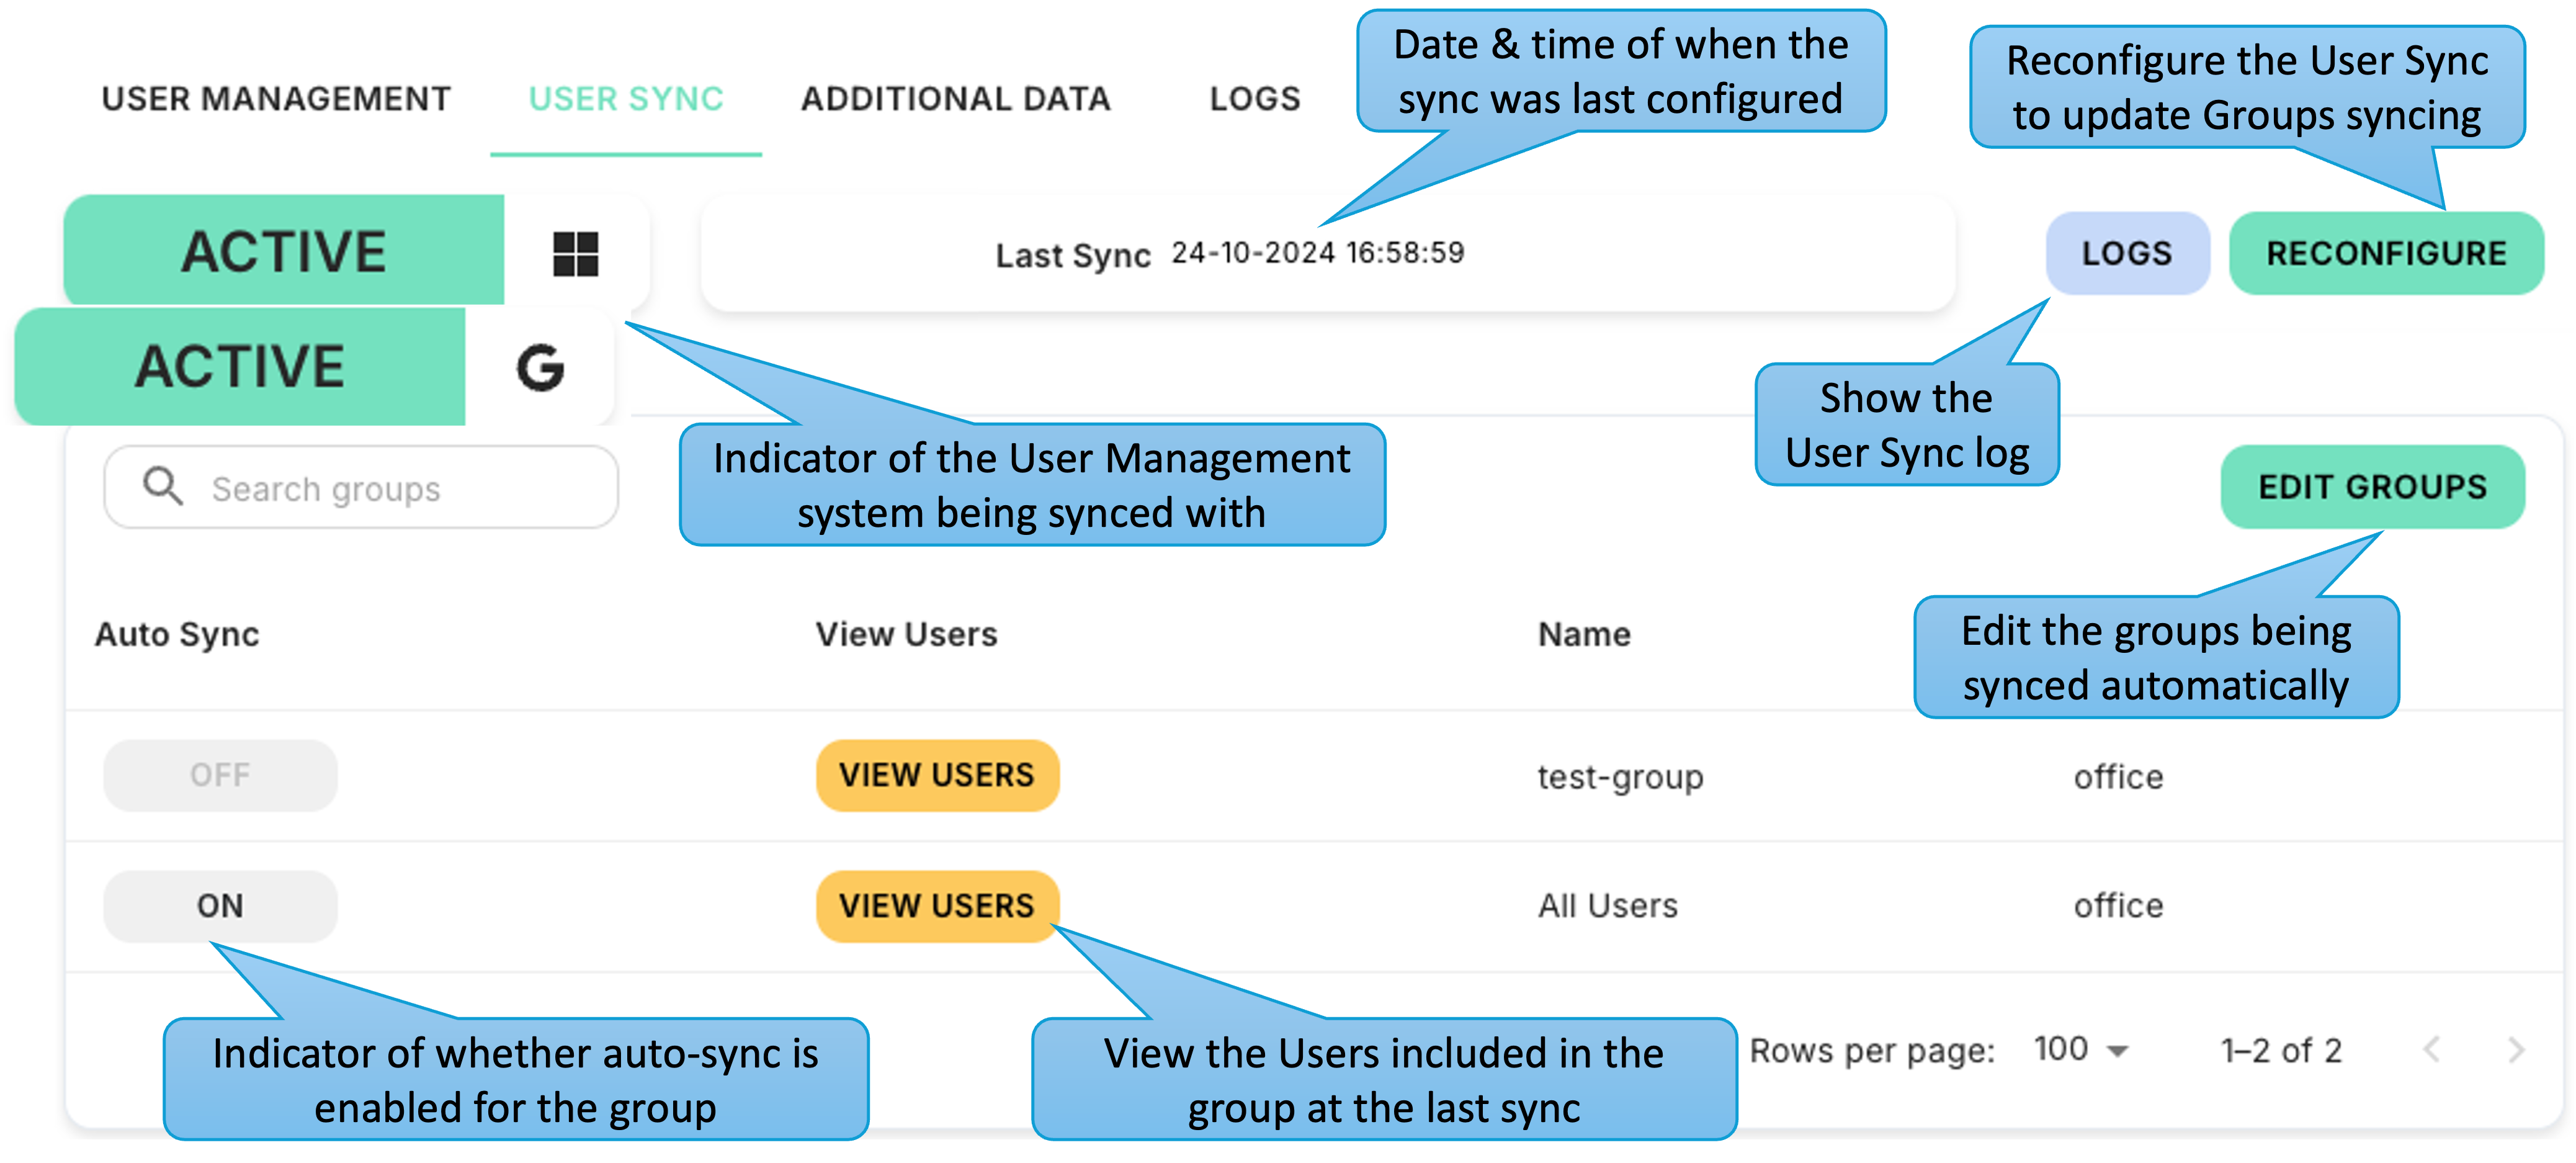
To update the groups that have auto-sync enabled select the 'Edit Groups' button and the table will switch to edit mode, allowing the auto-sync to be toggled on and off. Once happy with the changes these can be saved by clicking the 'Update Auto Sync' button.

If the Organisational Units or User Groups that are being synced are updated, or new ones added, it will be necessary to reconfigure the user sync and re-run the import of groups. This can be done by clicking the 'Reconfigure' button and following the same process as the initial set-up.
Additional Data
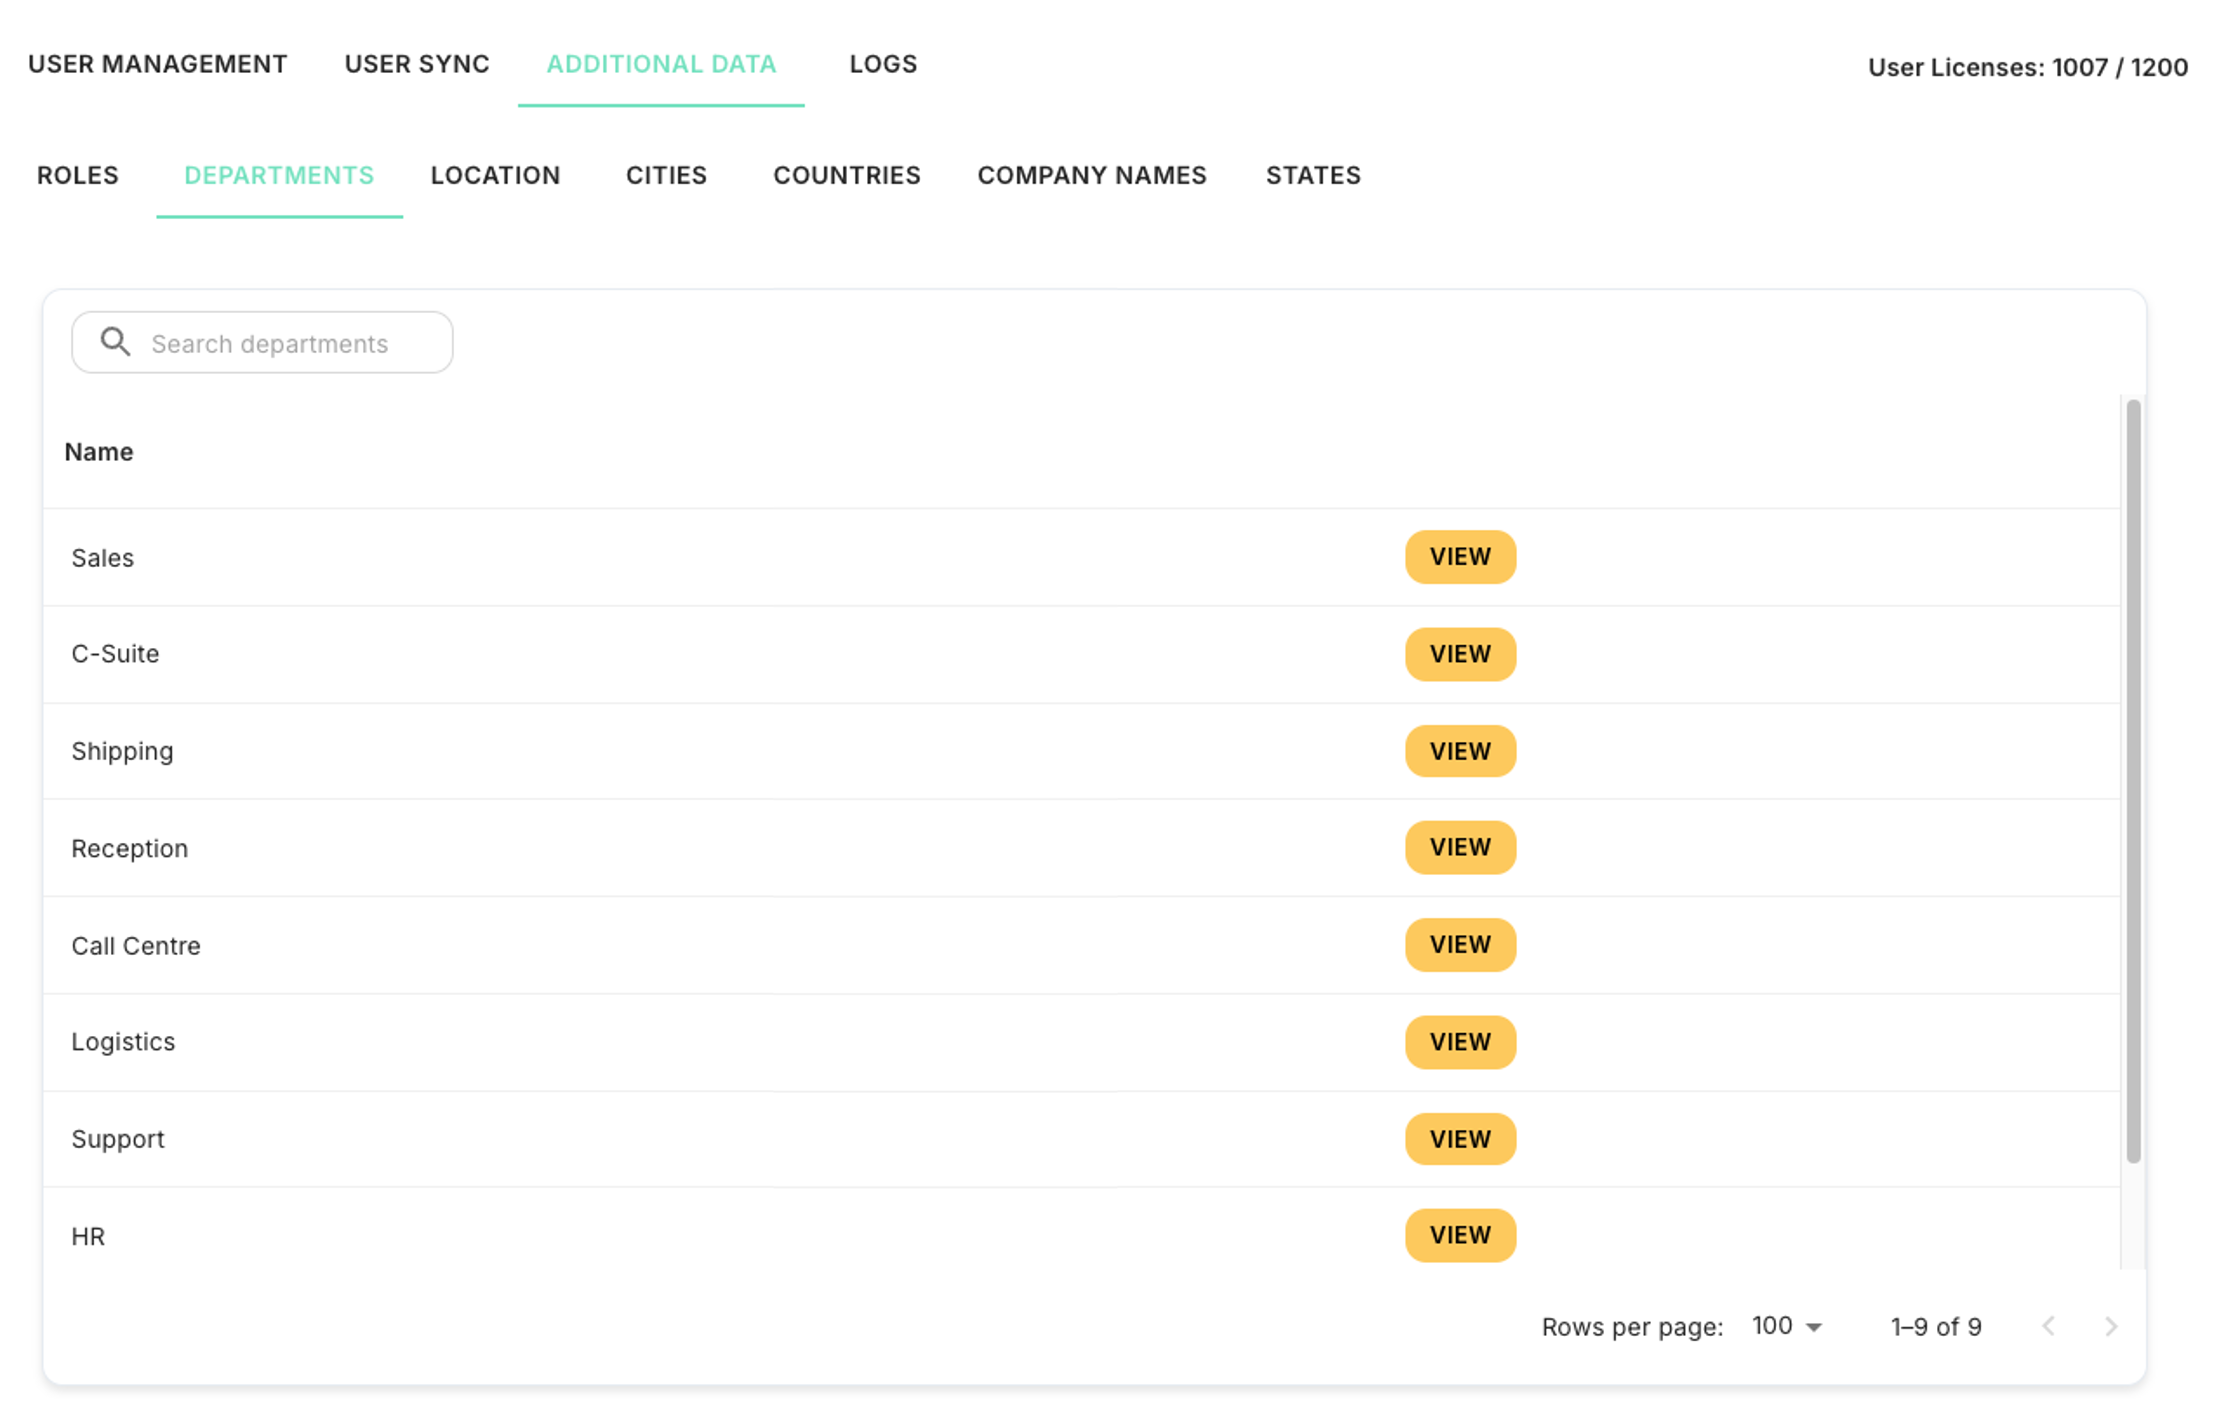
The 'Additional Data' tab allows the administrator to see all the values within the system for the various user attributes, and by clicking 'View', see all the users with each attribute value.
Logs
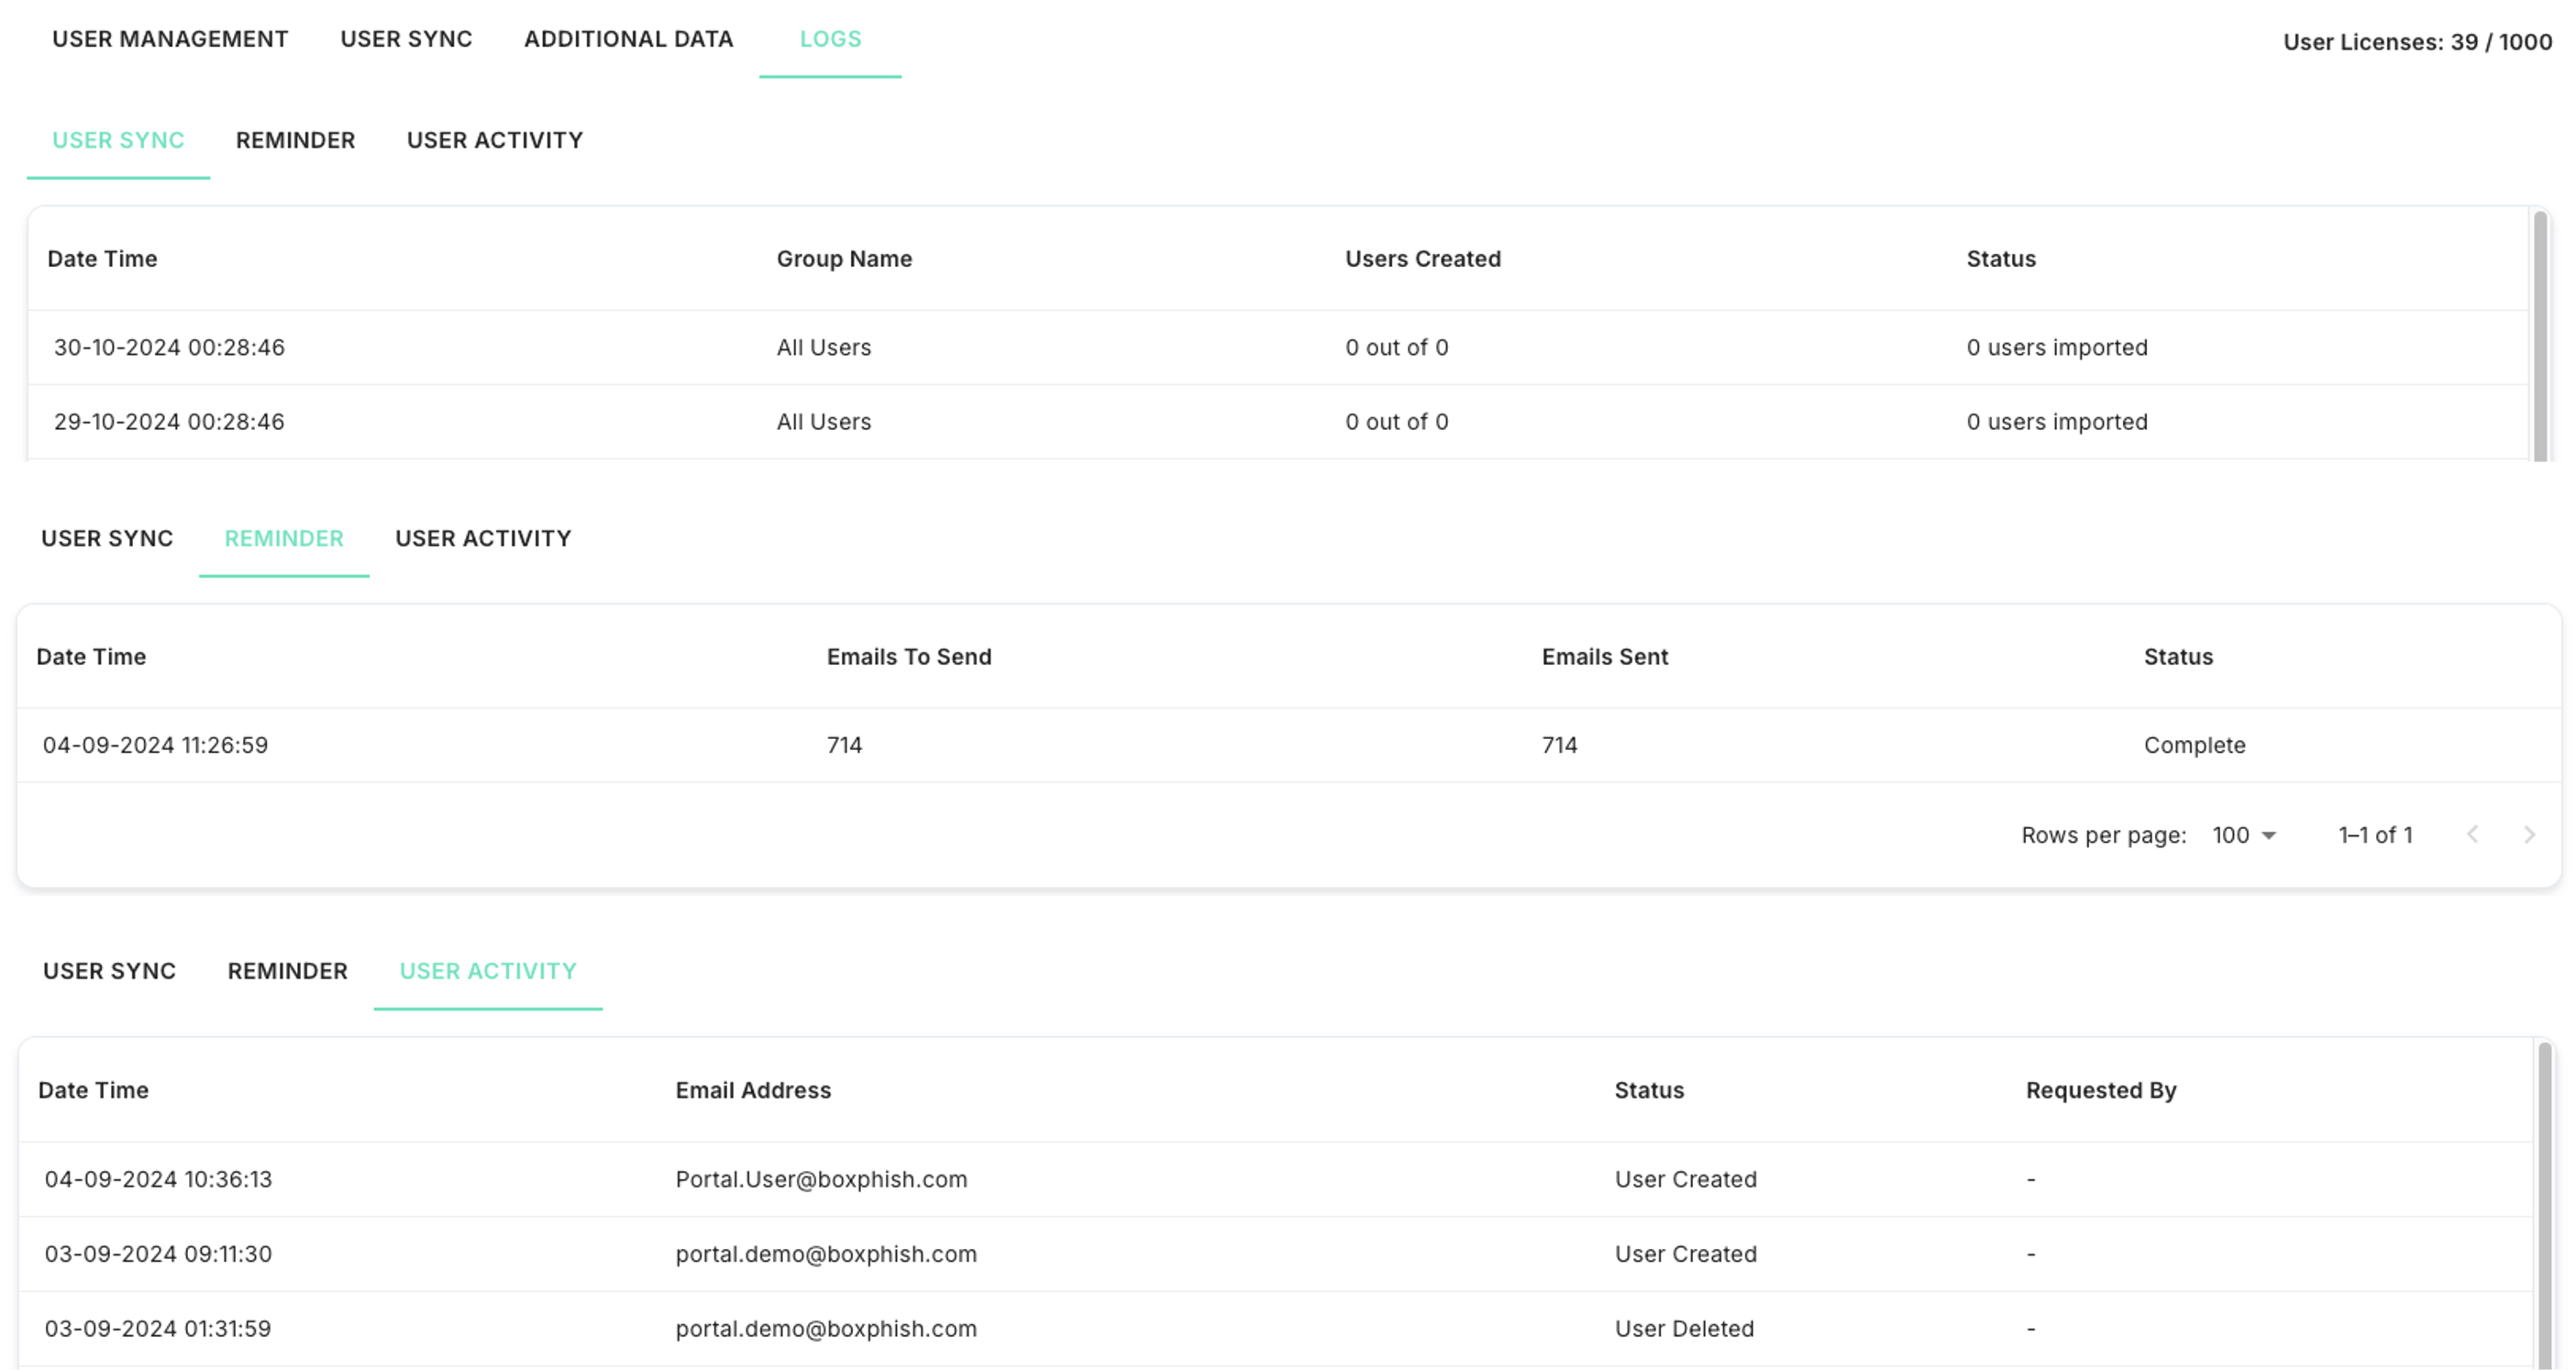
The 'Logs' tab allows an administrator to view activity related to user management. It is split into three main process logs:
- User Sync: Provides a summary of the run status and number of users created for each group set up in the user sync.
- Reminder: Provides the progress of any active reminder sends that were triggered in the UI, and its status once complete.
- User Activity: Provides details of any users created or deleted, and the details of the administrator that performed the action if done through the UI. Where this field is blank the action was performed by the user sync functionality.
Settings
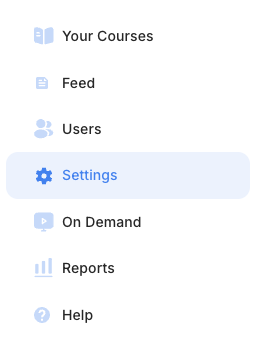
By selecting the 'Settings' option in the left hand menu, shown below, an administrator can control certain system configuration and find information about how to integrate the application within their estate. This section is split into five areas; 'General', 'Deliverability', 'Branding, 'Company Information' and 'Phish Report Button'. This section of the guide will run through each in turn.
General
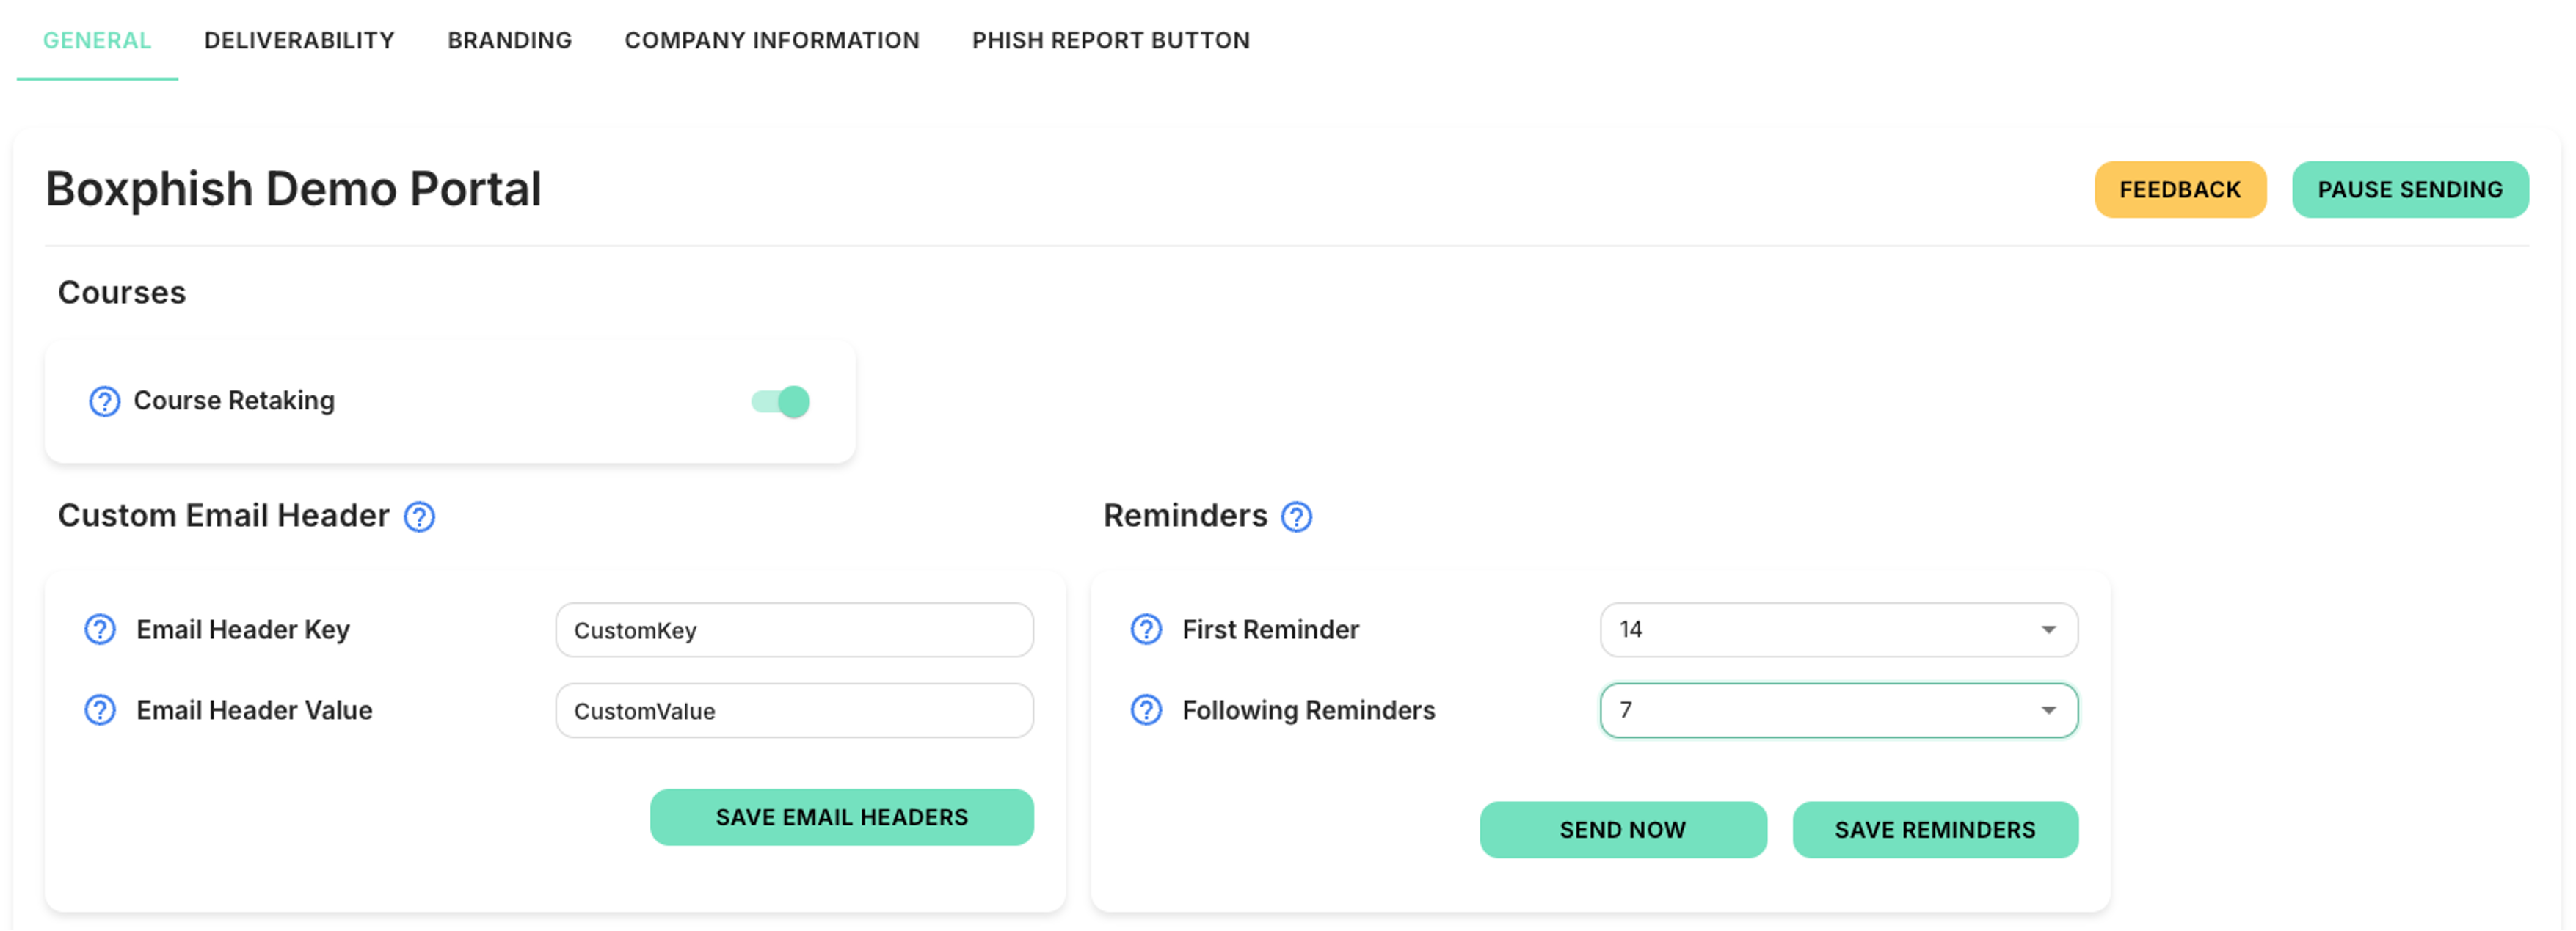
The 'General' tab allows an administrator control various aspects of the system as detailed below:
- Course Retaking: Enabling this option allows users to retake a Course if they do not achieve the necessary score. The Course will remain in the 'Outstanding Courses' section of the 'Your Courses' page, rather than move to 'Completed Courses'.
- Custom Email Header: Supports the addition of custom email headers for their tenancies which will be included in emails sent from the platform. This allows administrators greater control within their allow listing configuration.
- Reminders: Enables automated reminders that will be sent to users that have outstanding Courses. The time before the first send and subsequent follow-ups can be configured separately. Where users have multiple outstanding Courses a single email will be sent with a summary. Administrators can also trigger the sending of reminders immediately by clicking 'Send Now'.
- Feedback: Send feedback directly to the Product team from the UI on the Application, we are always keen to hear suggestions on improving the User Experience. For Product Support issues please don’t hesitate to contact our support team at support@boxphish.com and we will be happy to help.
- Pause Sending: Temporarily suspend the sending of any emails from Journeys and reminders to all users.
Branding
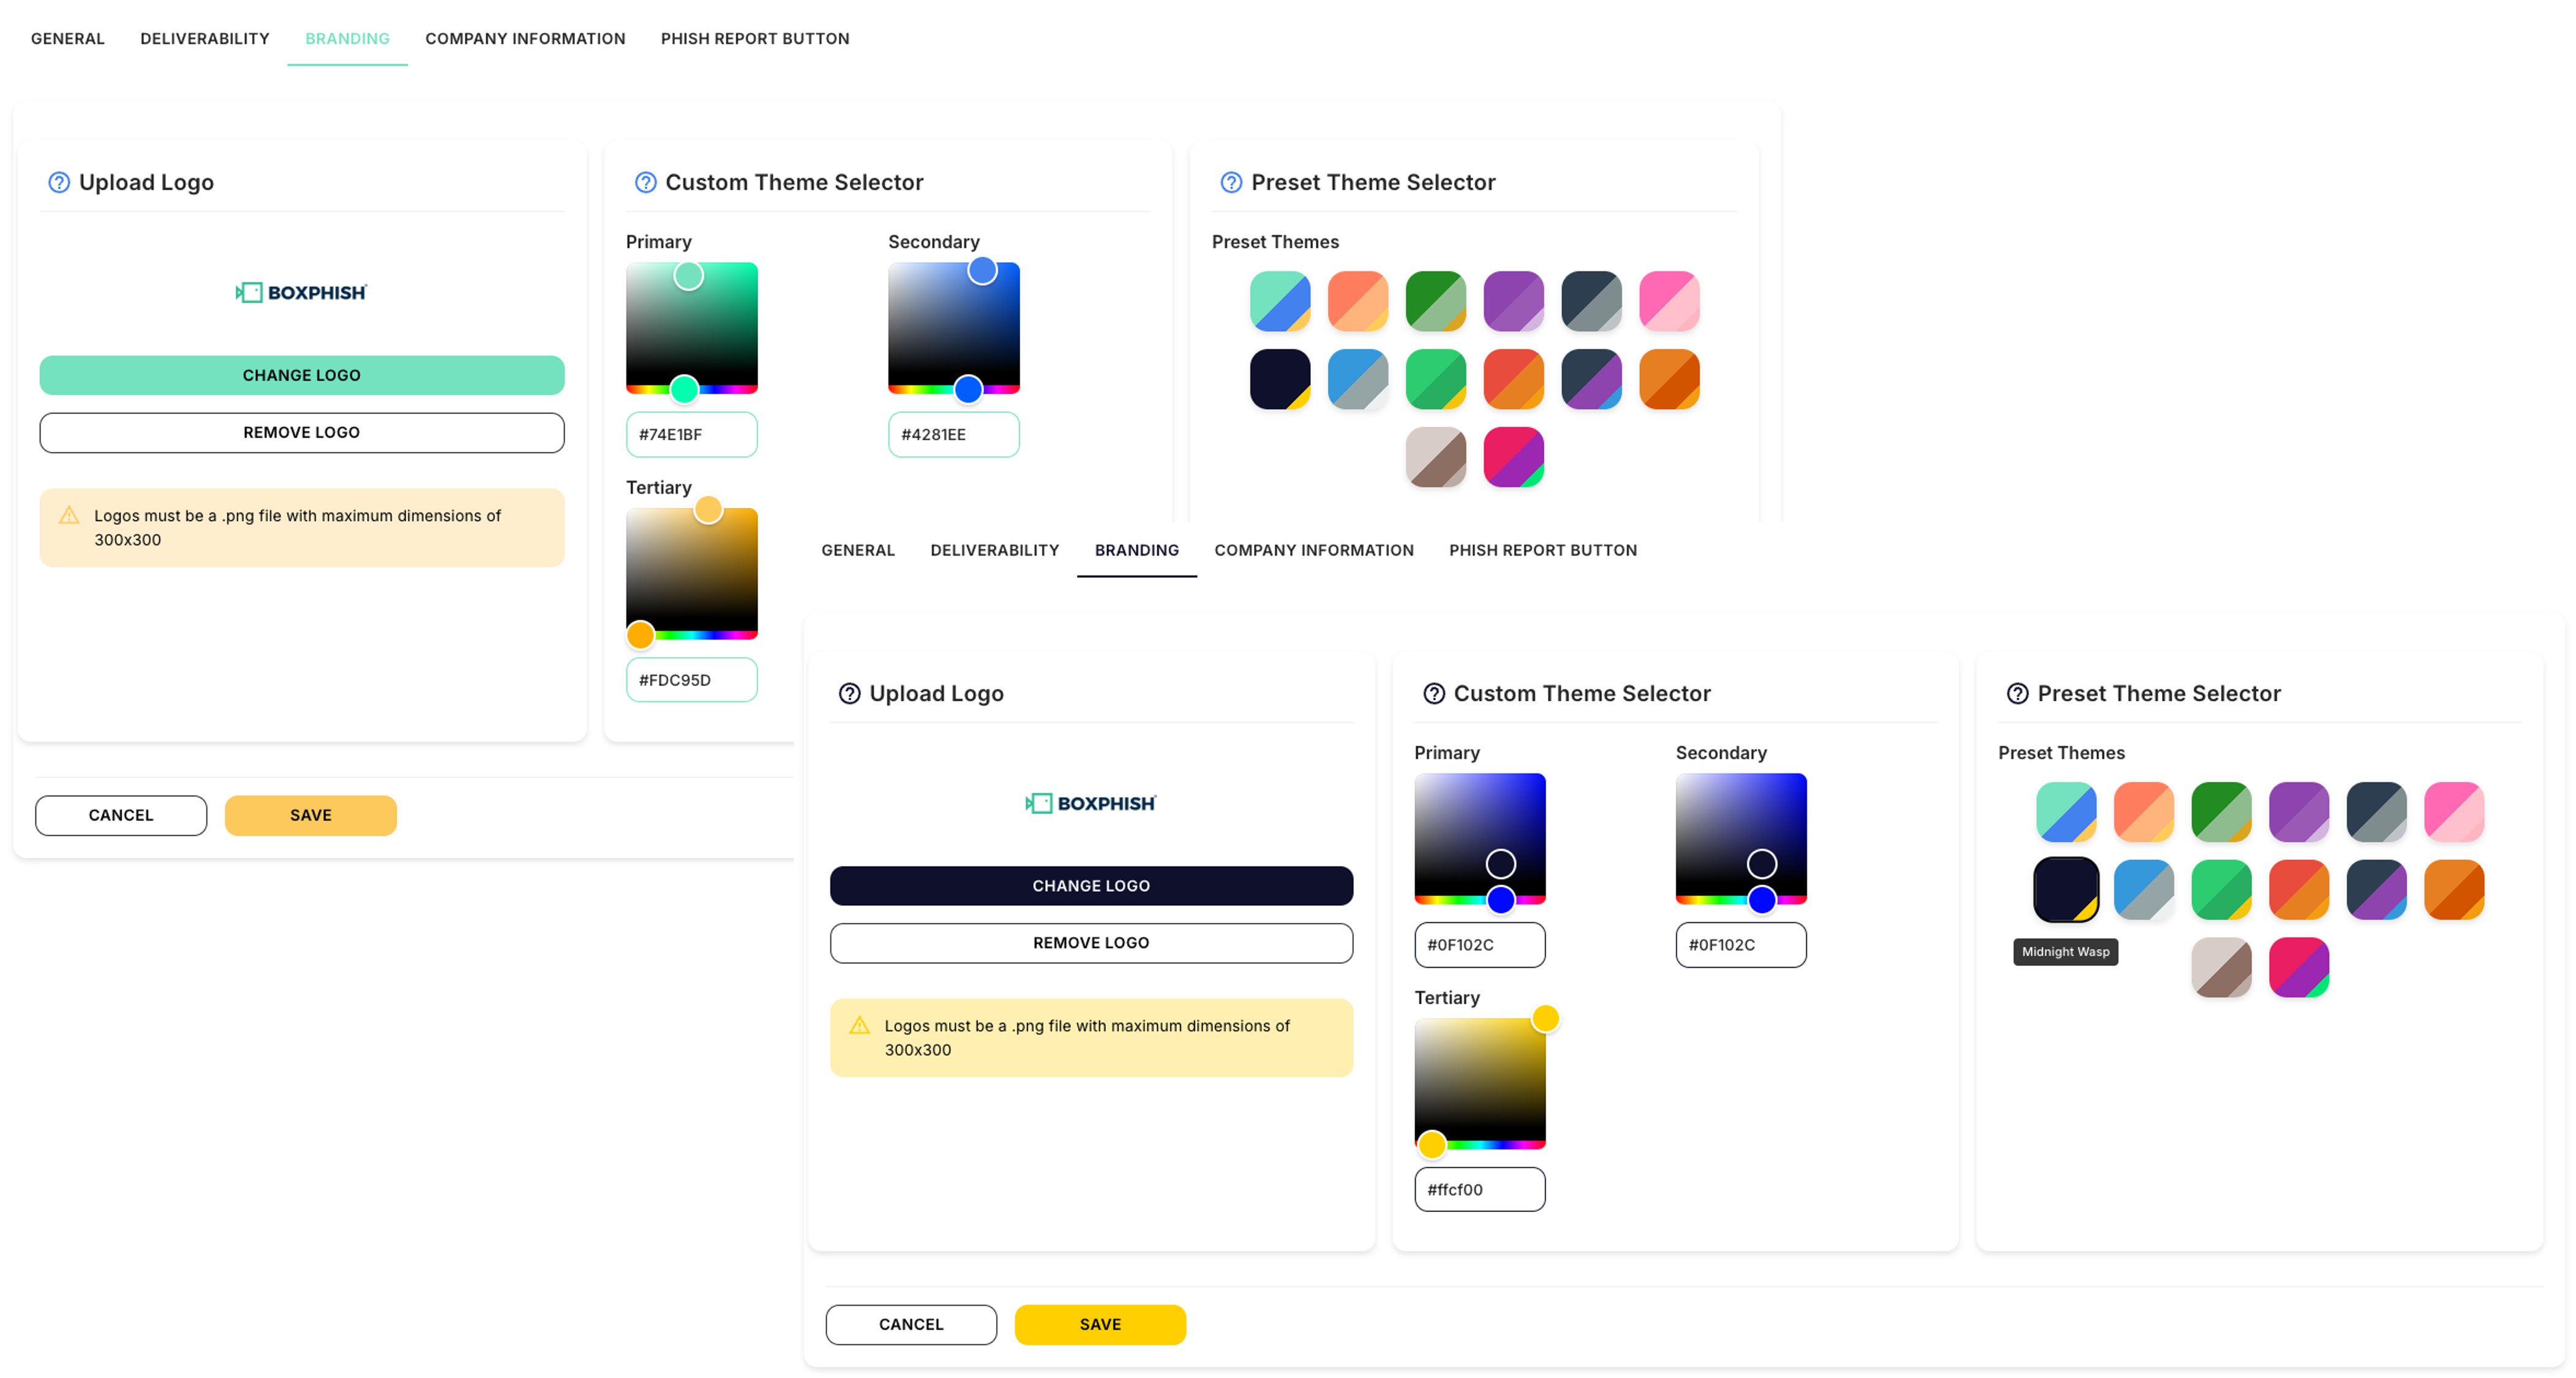
The 'Branding' tab allows an administrator control the logos and colour themes used by the UI and various other aspects of the system:
- Logo: This allows a company logo to be applied to the tenancy for use wherever a logo is required. In the UI this will change the logo shown in the top left of the application.
- Custom Theme Selector: Here the colour theme of various buttons, menus and icons can be customised, allowing the administrator to tailor the UI to their company branding, asking it more familiar to users. The UI provides a simple colour selector or the entry of a Hex code if this is known.
- Preset Theme Selector: Allows the administrator to select some predefined themes with colours that compliment each other and are recommended for accessibility.
Deliverability
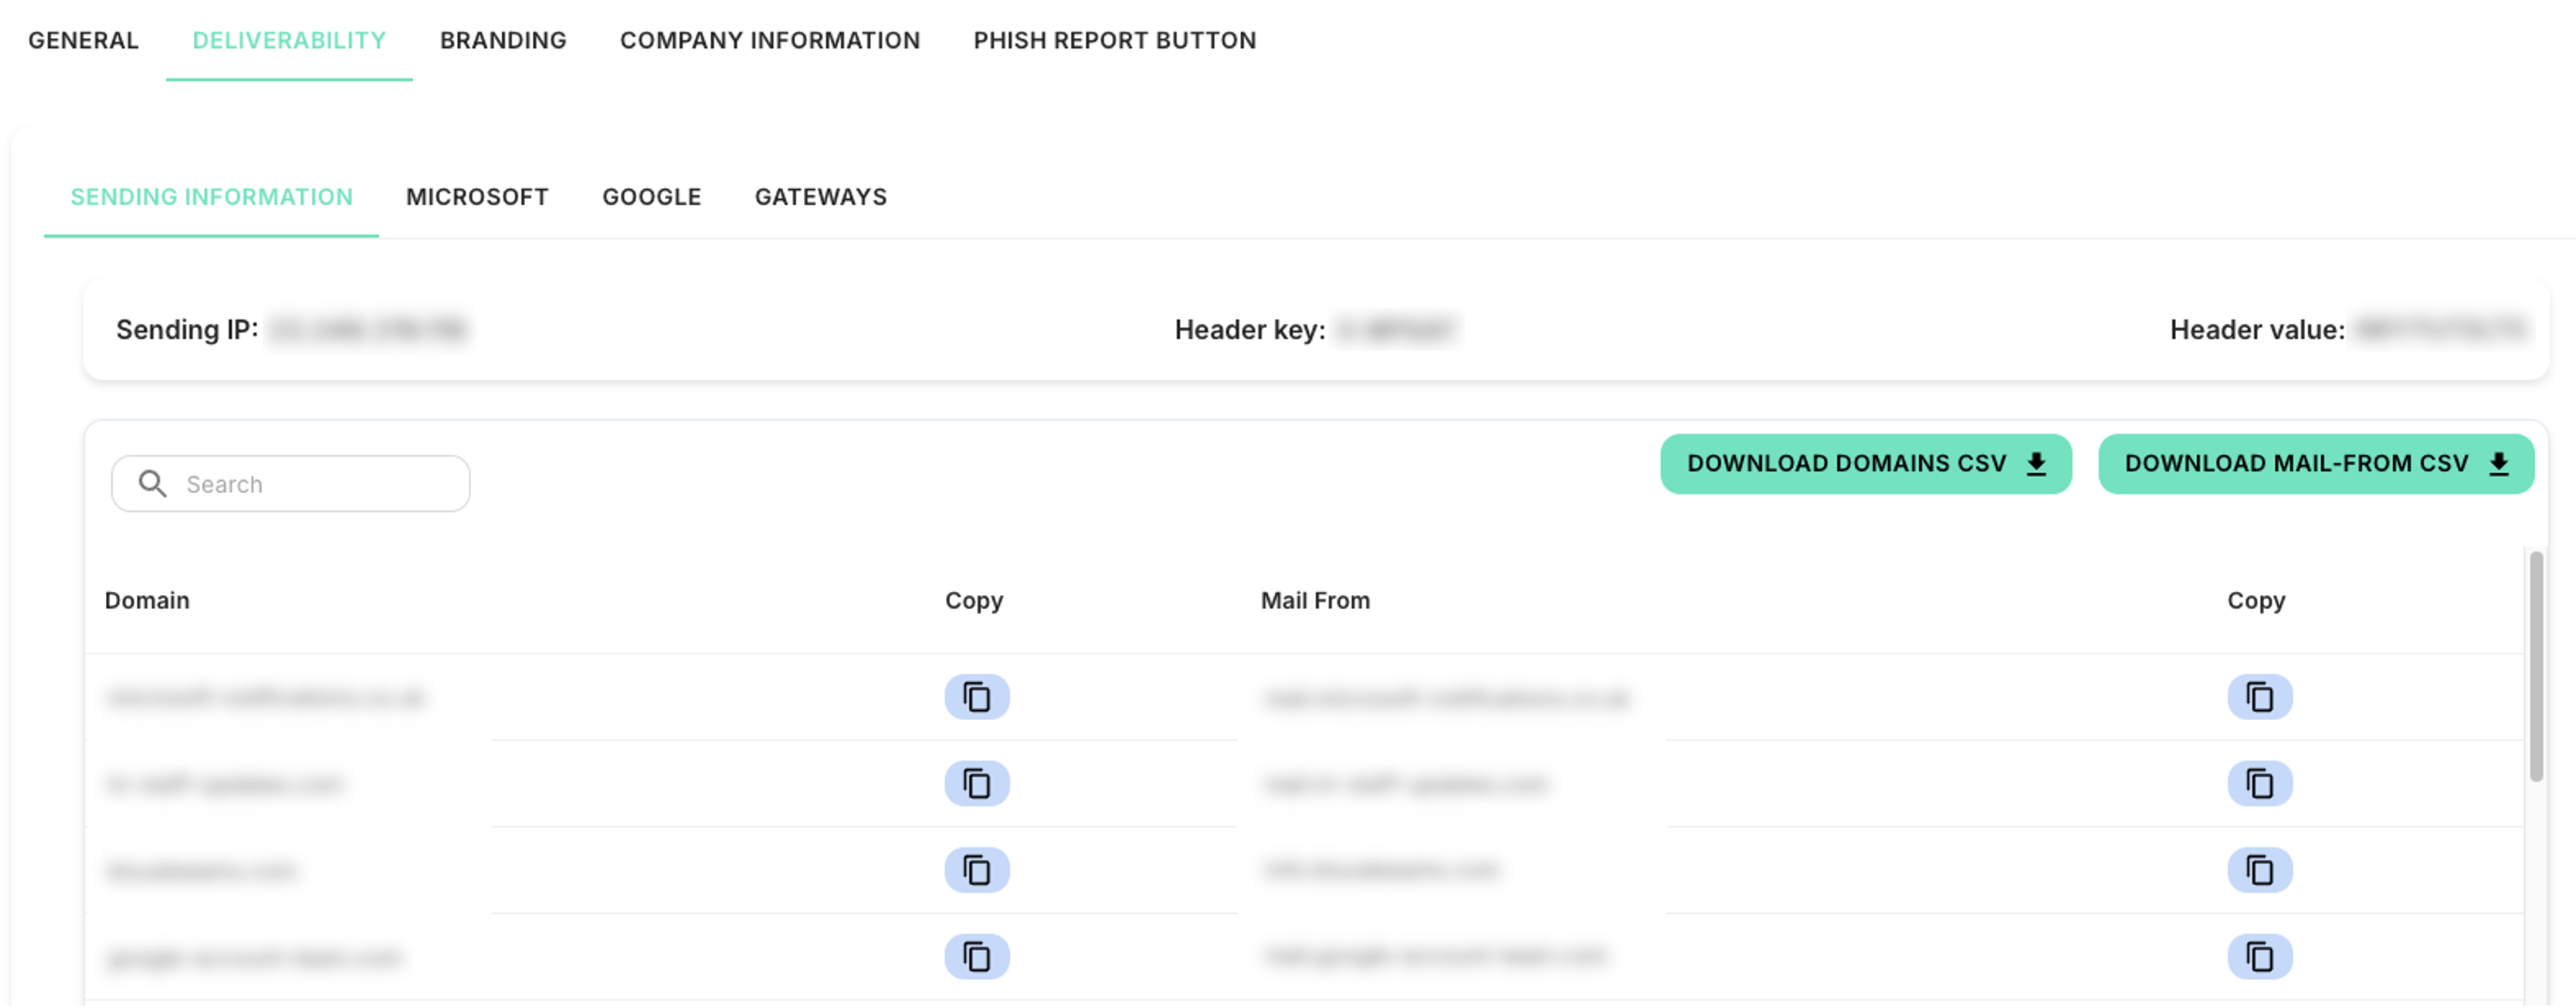
The 'Deliverability' tab provides detailed information on the emails that are sent by the application, including the IP, Headers, Domains and Mail From settings. From this tab the 'Domains' and 'Mail From' lists can be exported to simplify updates needed to a company's email infrastructure. Also included are detailed guides for configuring Microsoft and Google, plus various email gateways.
Company Information
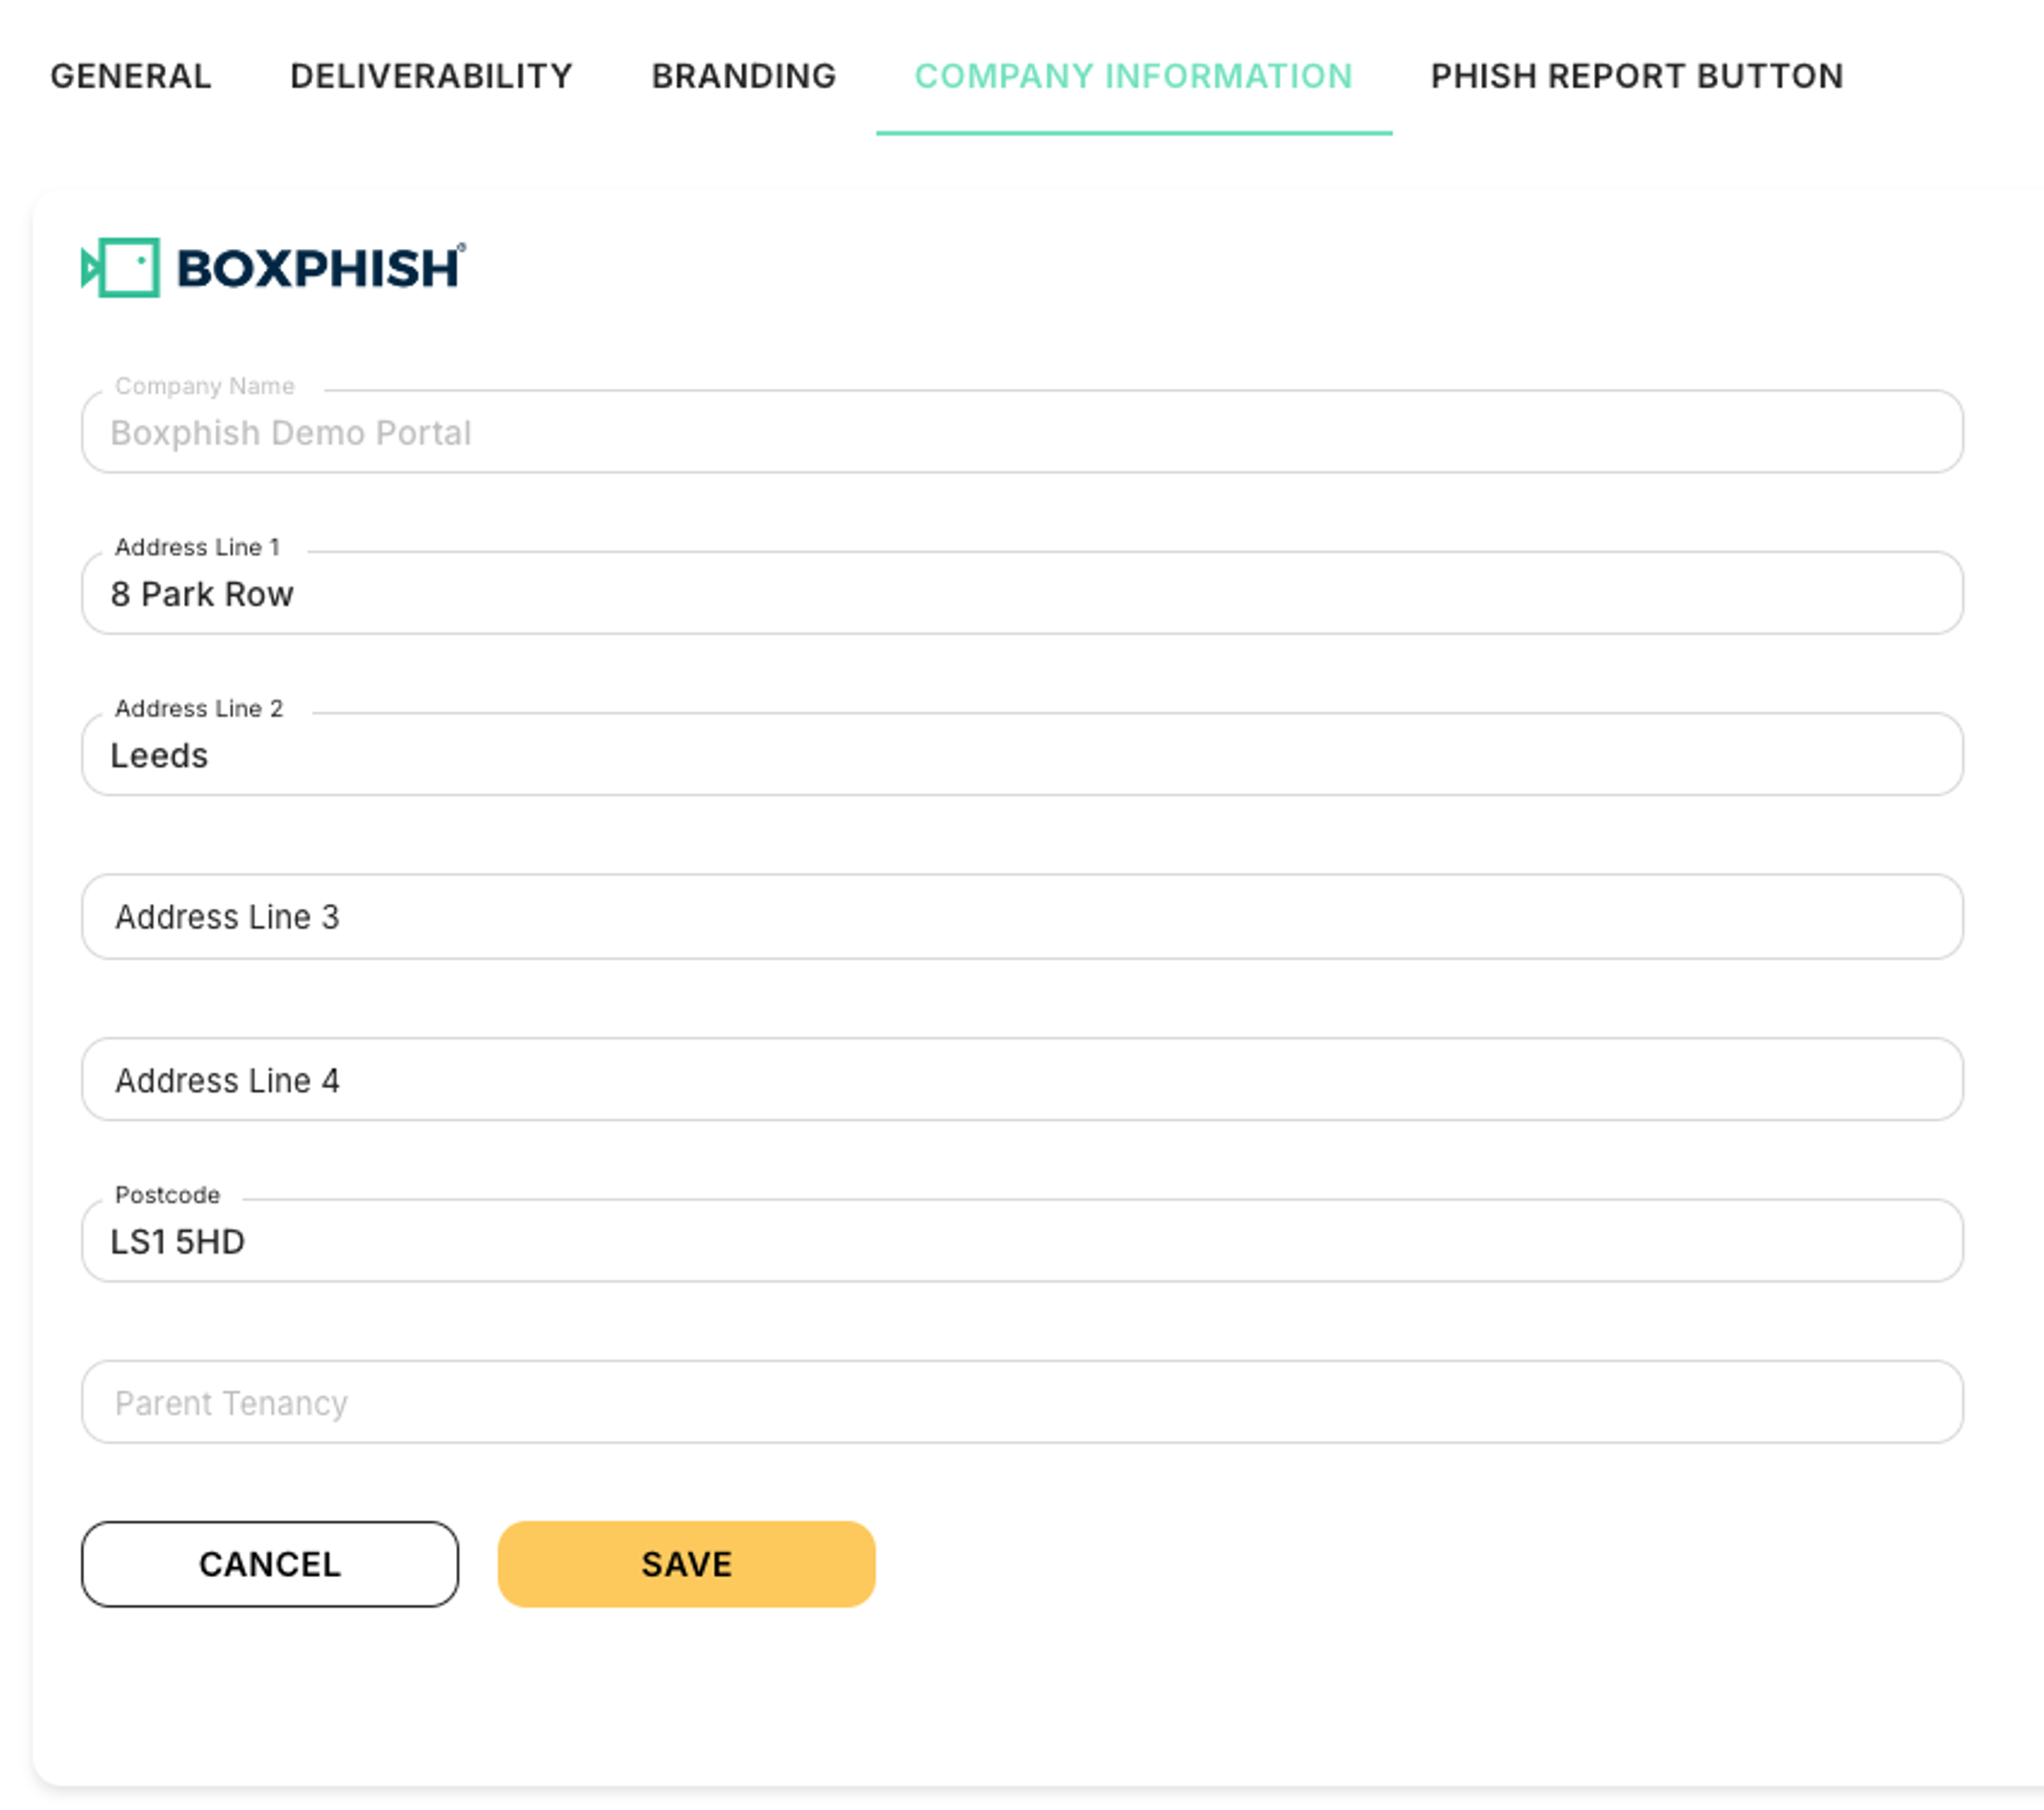
The 'Company Information' tab allows an administrator to view and update various attributes.
Phish Report Button
The 'Phish Report Button' tab allows an administrator configure an Outlook plug in provided by Boxphish for reporting emails that a user suspects of being a phishing email. When installed the button is available in Outlook and looks like the image below:

The Phish Report button empowers users to report any email they are suspicious of. This will then identify whether it is a phishing simulation sent by Boxphish, displaying a message accordingly and processing the email, or from a 3rd party, displaying a different message and forwarding on to the configured location. The diagram below shows the high level flow of the plug in.

Within the 'Phish Report Button' tab the administrator can set a forwarding address for 3rd party emails and grant the necessary permissions for the button to be installed. Also accessible are 'Install' and 'Update' tabs which provide details on how to install and update the plug in respectively.

On Demand
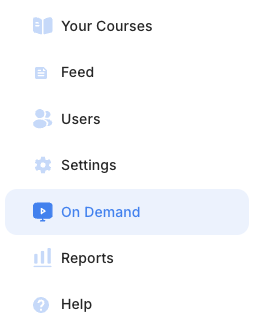
By selecting the 'On Demand' option in the left hand menu, shown below, an administrator, or user with elevated access, can create Course and Simulation sends to users, either directly or through various attributes, e.g. Department. Upcoming sends and a full history of sends can also be viewed. The page is split into two tabs; 'Schedule' and 'History'. This section of the guide will run through each in turn.
Schedule
The schedule tab supports the creation of Simulation sends by clicking the 'Simulation' button, and Course sends by clicking the 'Course' button, through a simple step by step wizard which is detailed in the following sections. It also displays the upcoming sends in a simple table with the option to cancel them if required.

Sending a Simulation
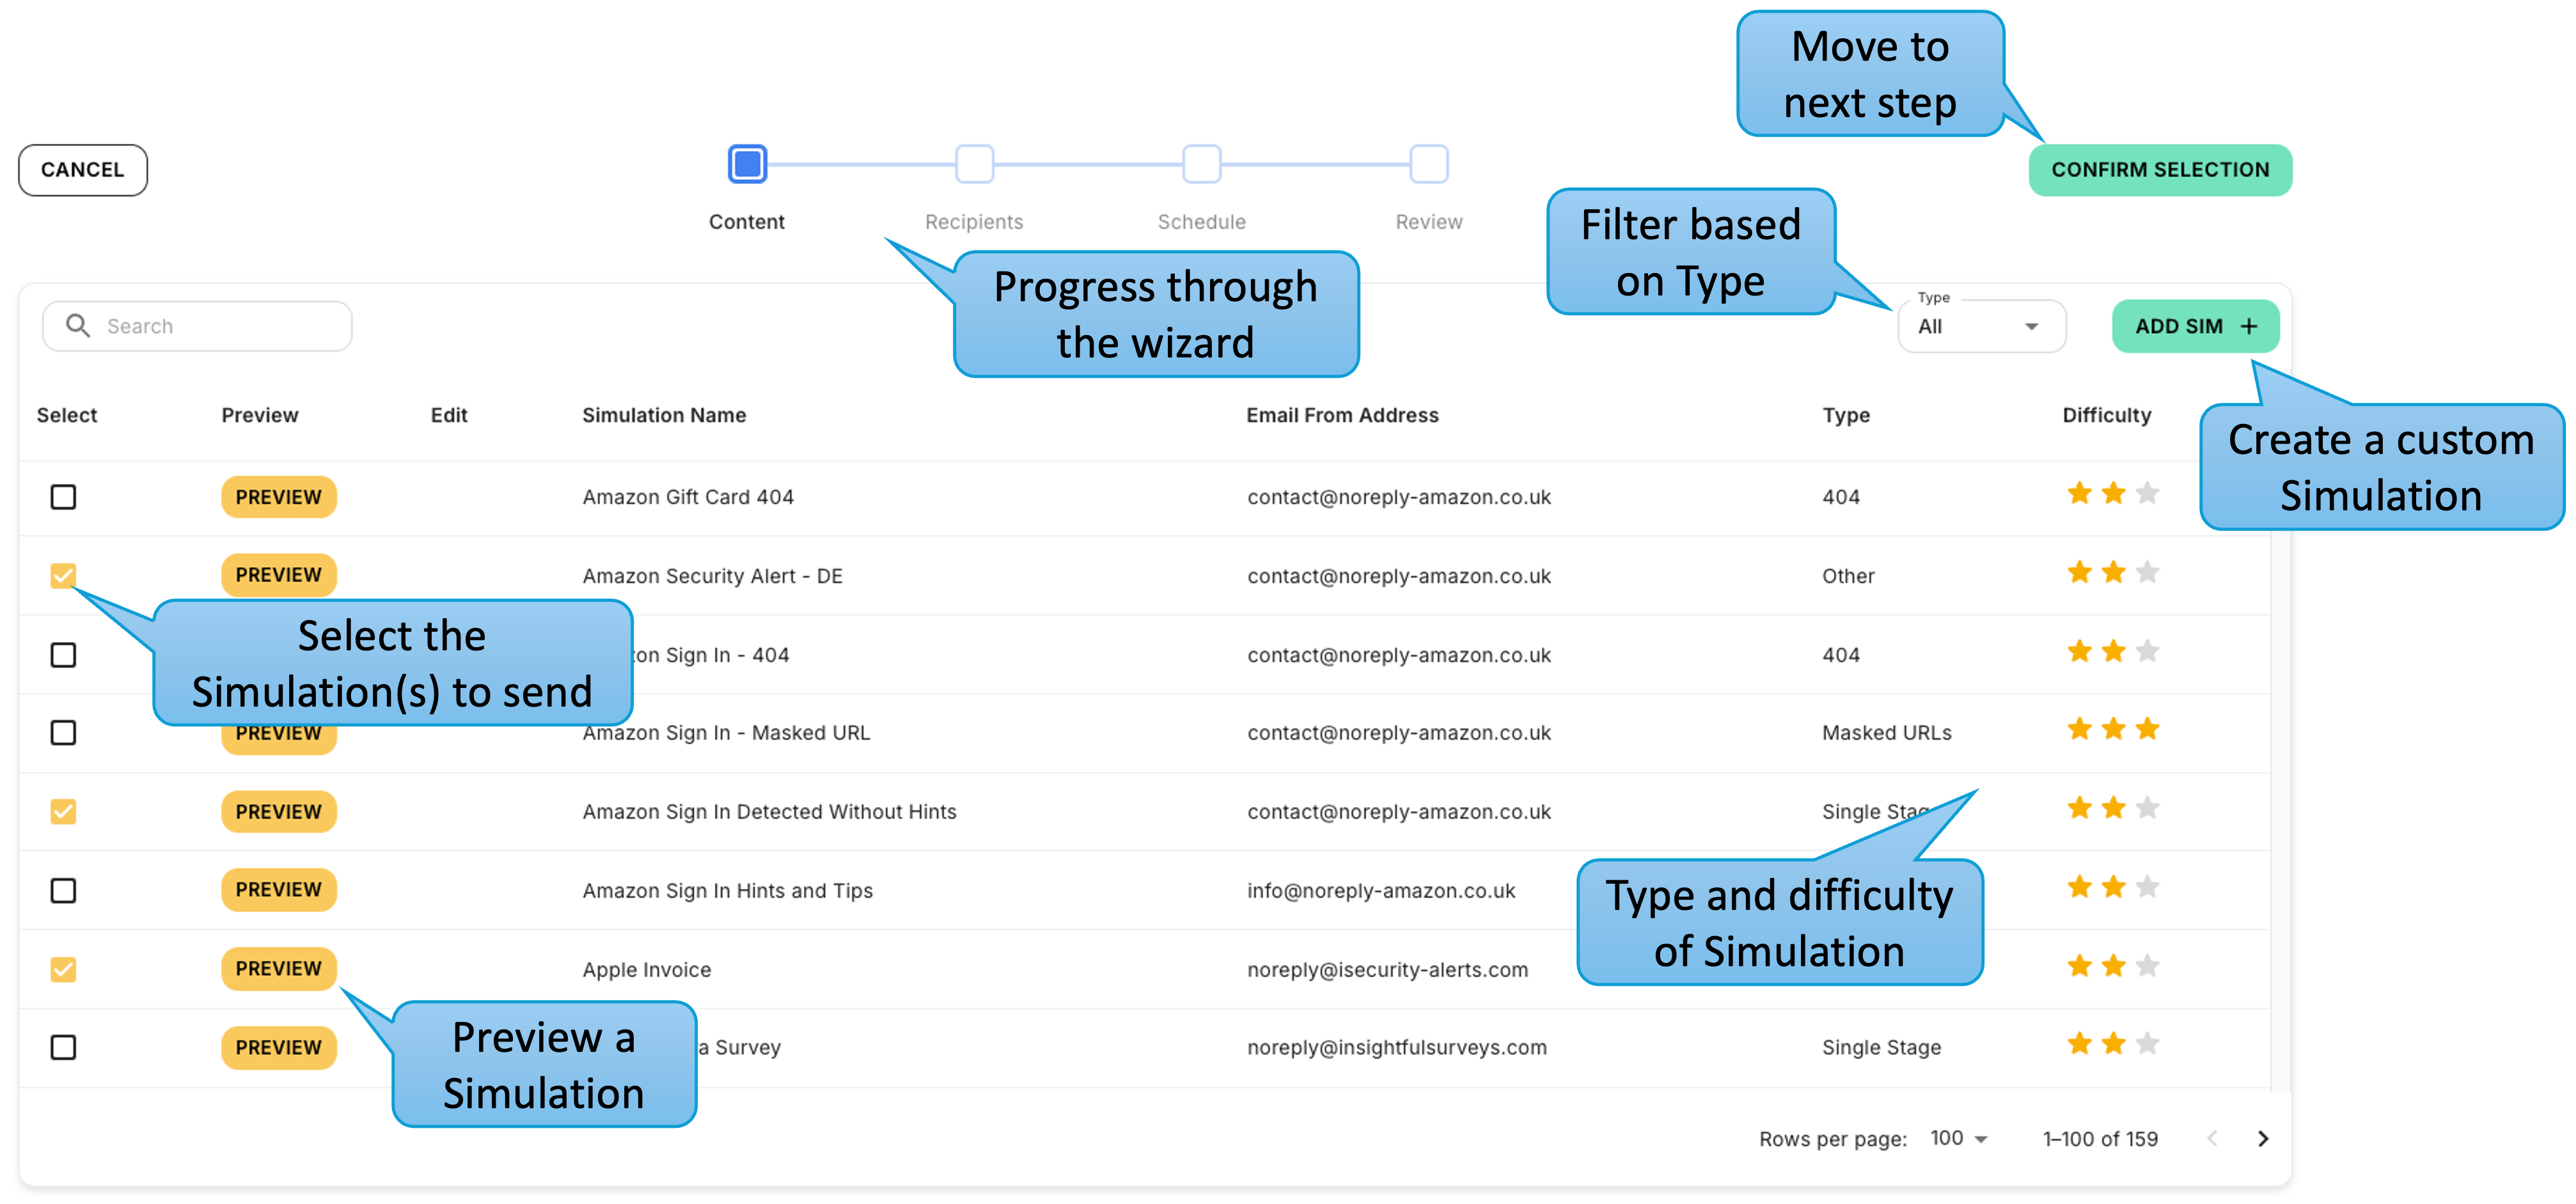
After clicking the 'Simulation' button the user is taken to a simple 4 step wizard to create a scheduled send as shown below. From here the user can select one or more Simulations to be included in the schedule from the library of available Simulations. The table provides details of the Simulations and the ability to 'Preview' how the Simulation email will appear. It also supports the creation of custom Simulations if desired.
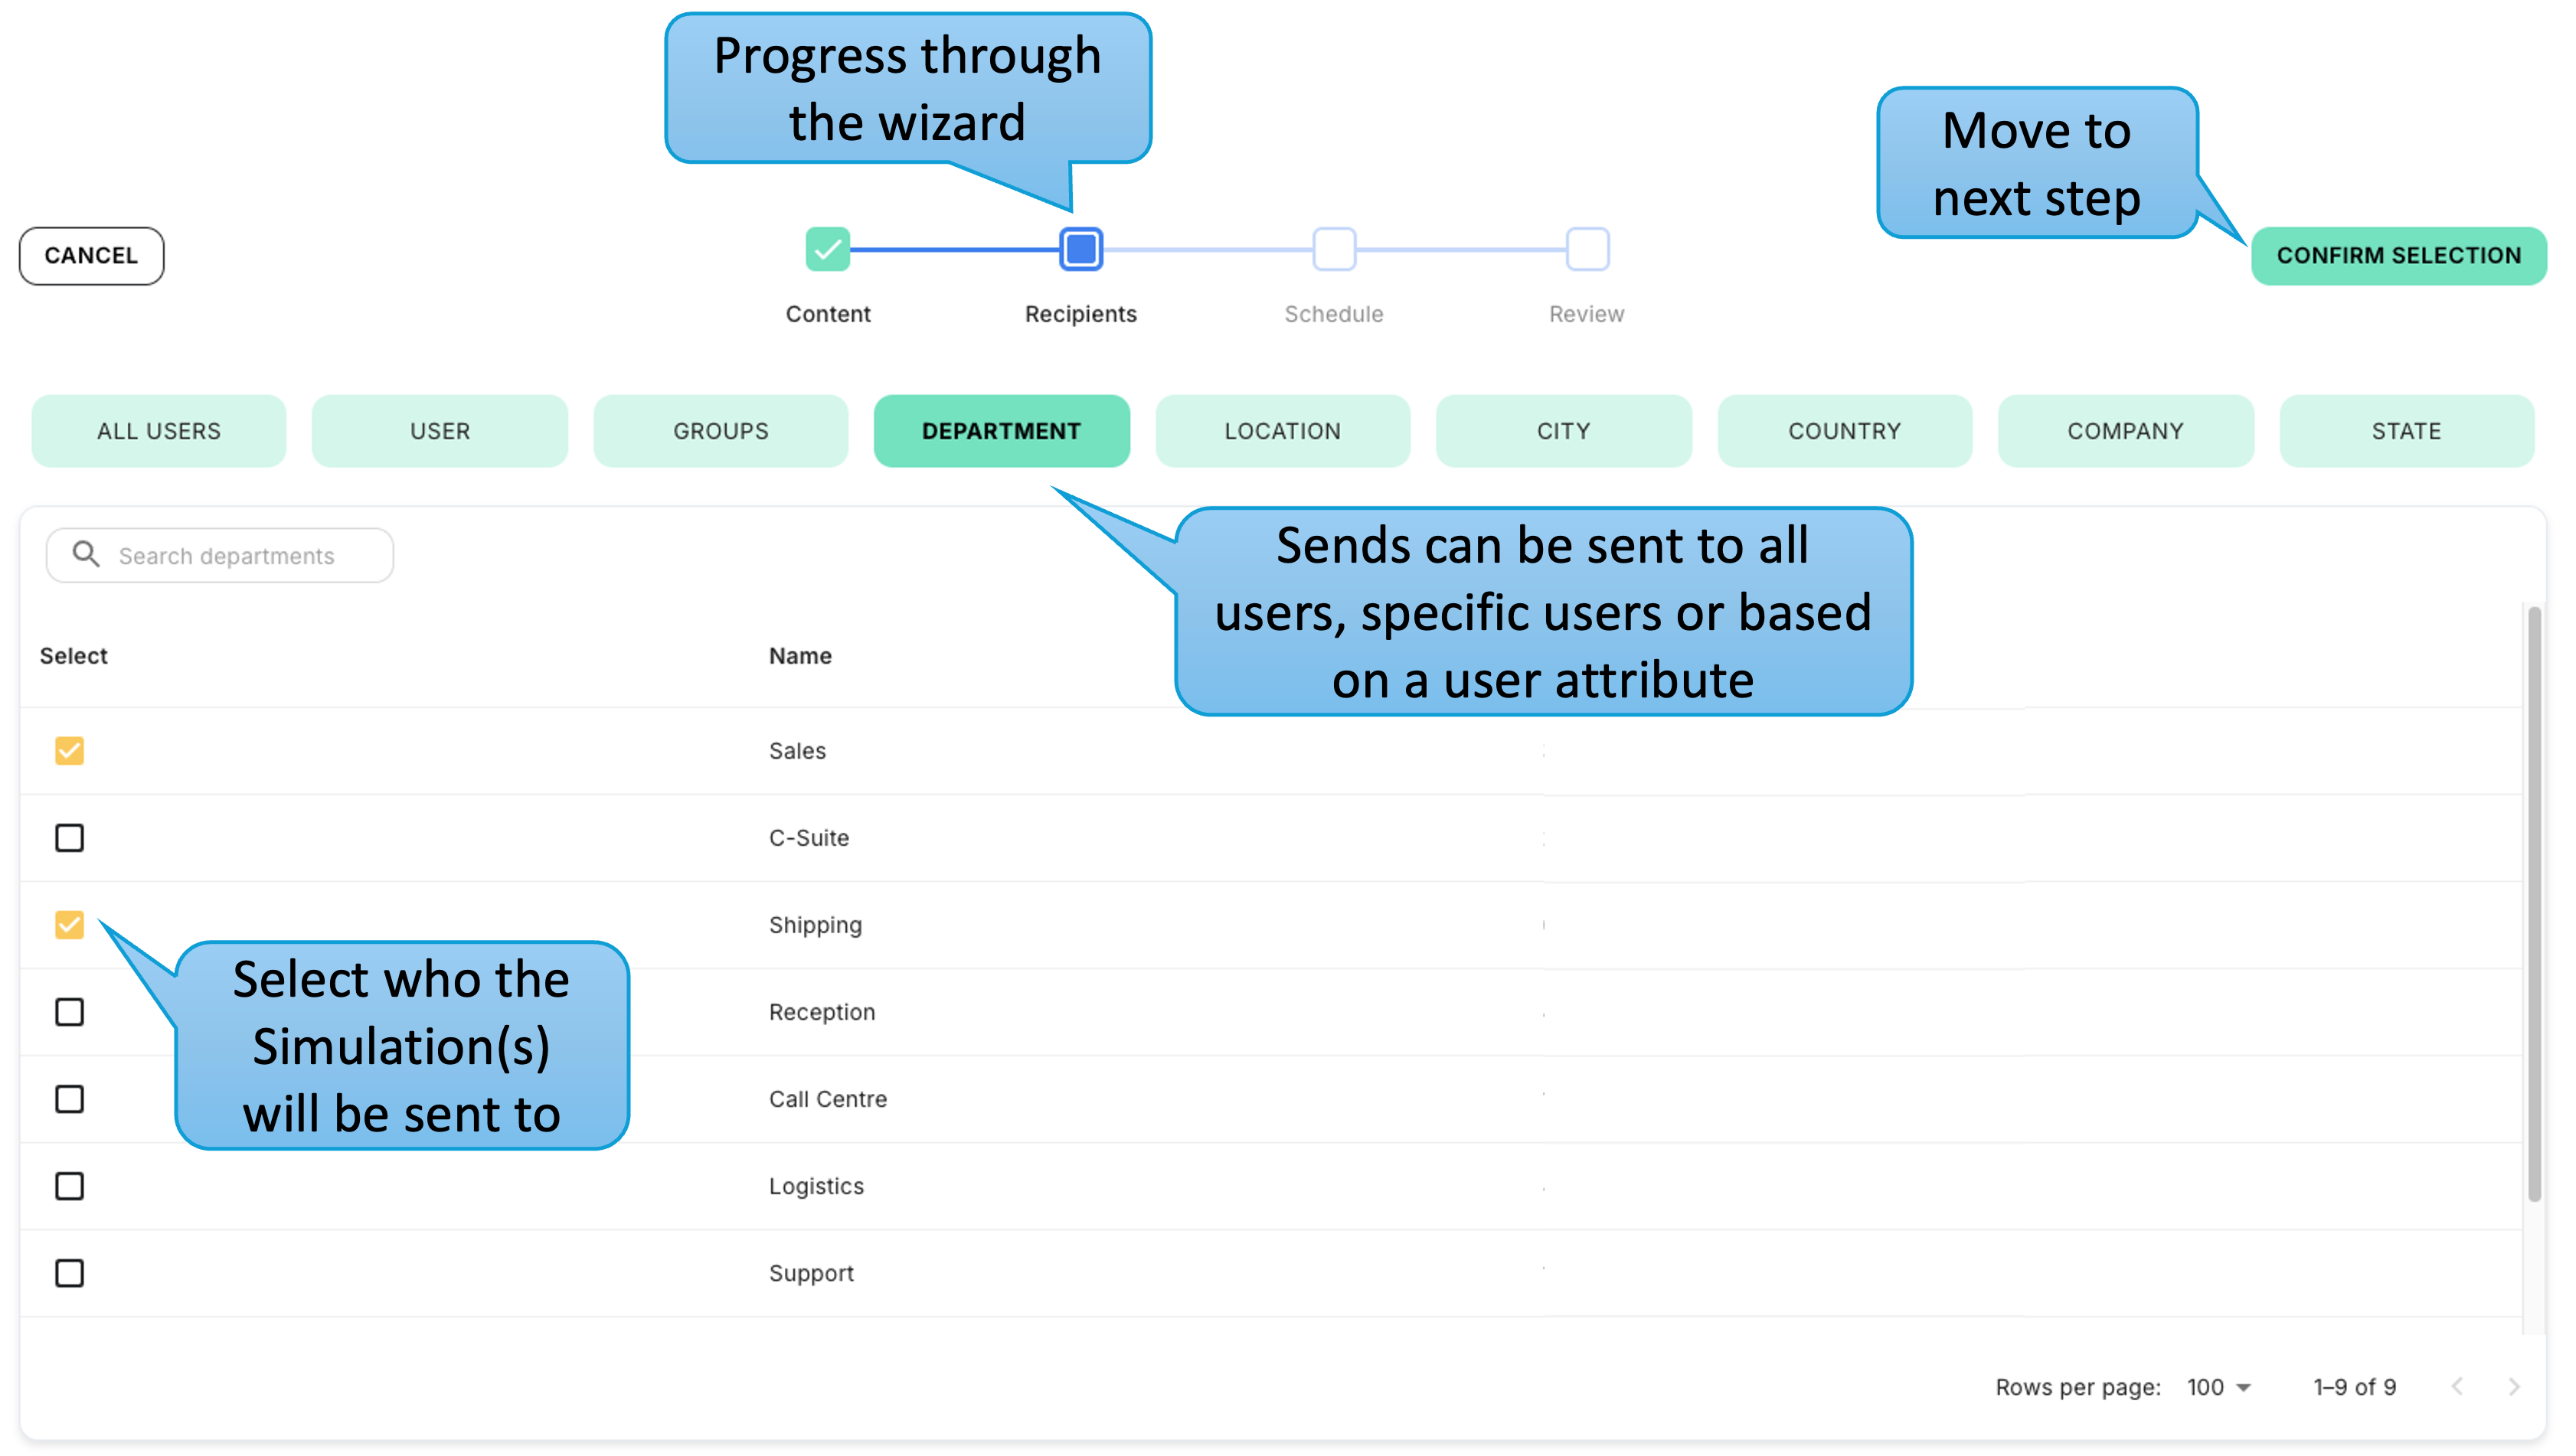
Once the Simulations have been selected by clicking the 'Confirm Selection' button the user can choose the recipients of a send. This can be to all users, explicitly chosen users or based on user attributes, such as User Group or Department as shown below.
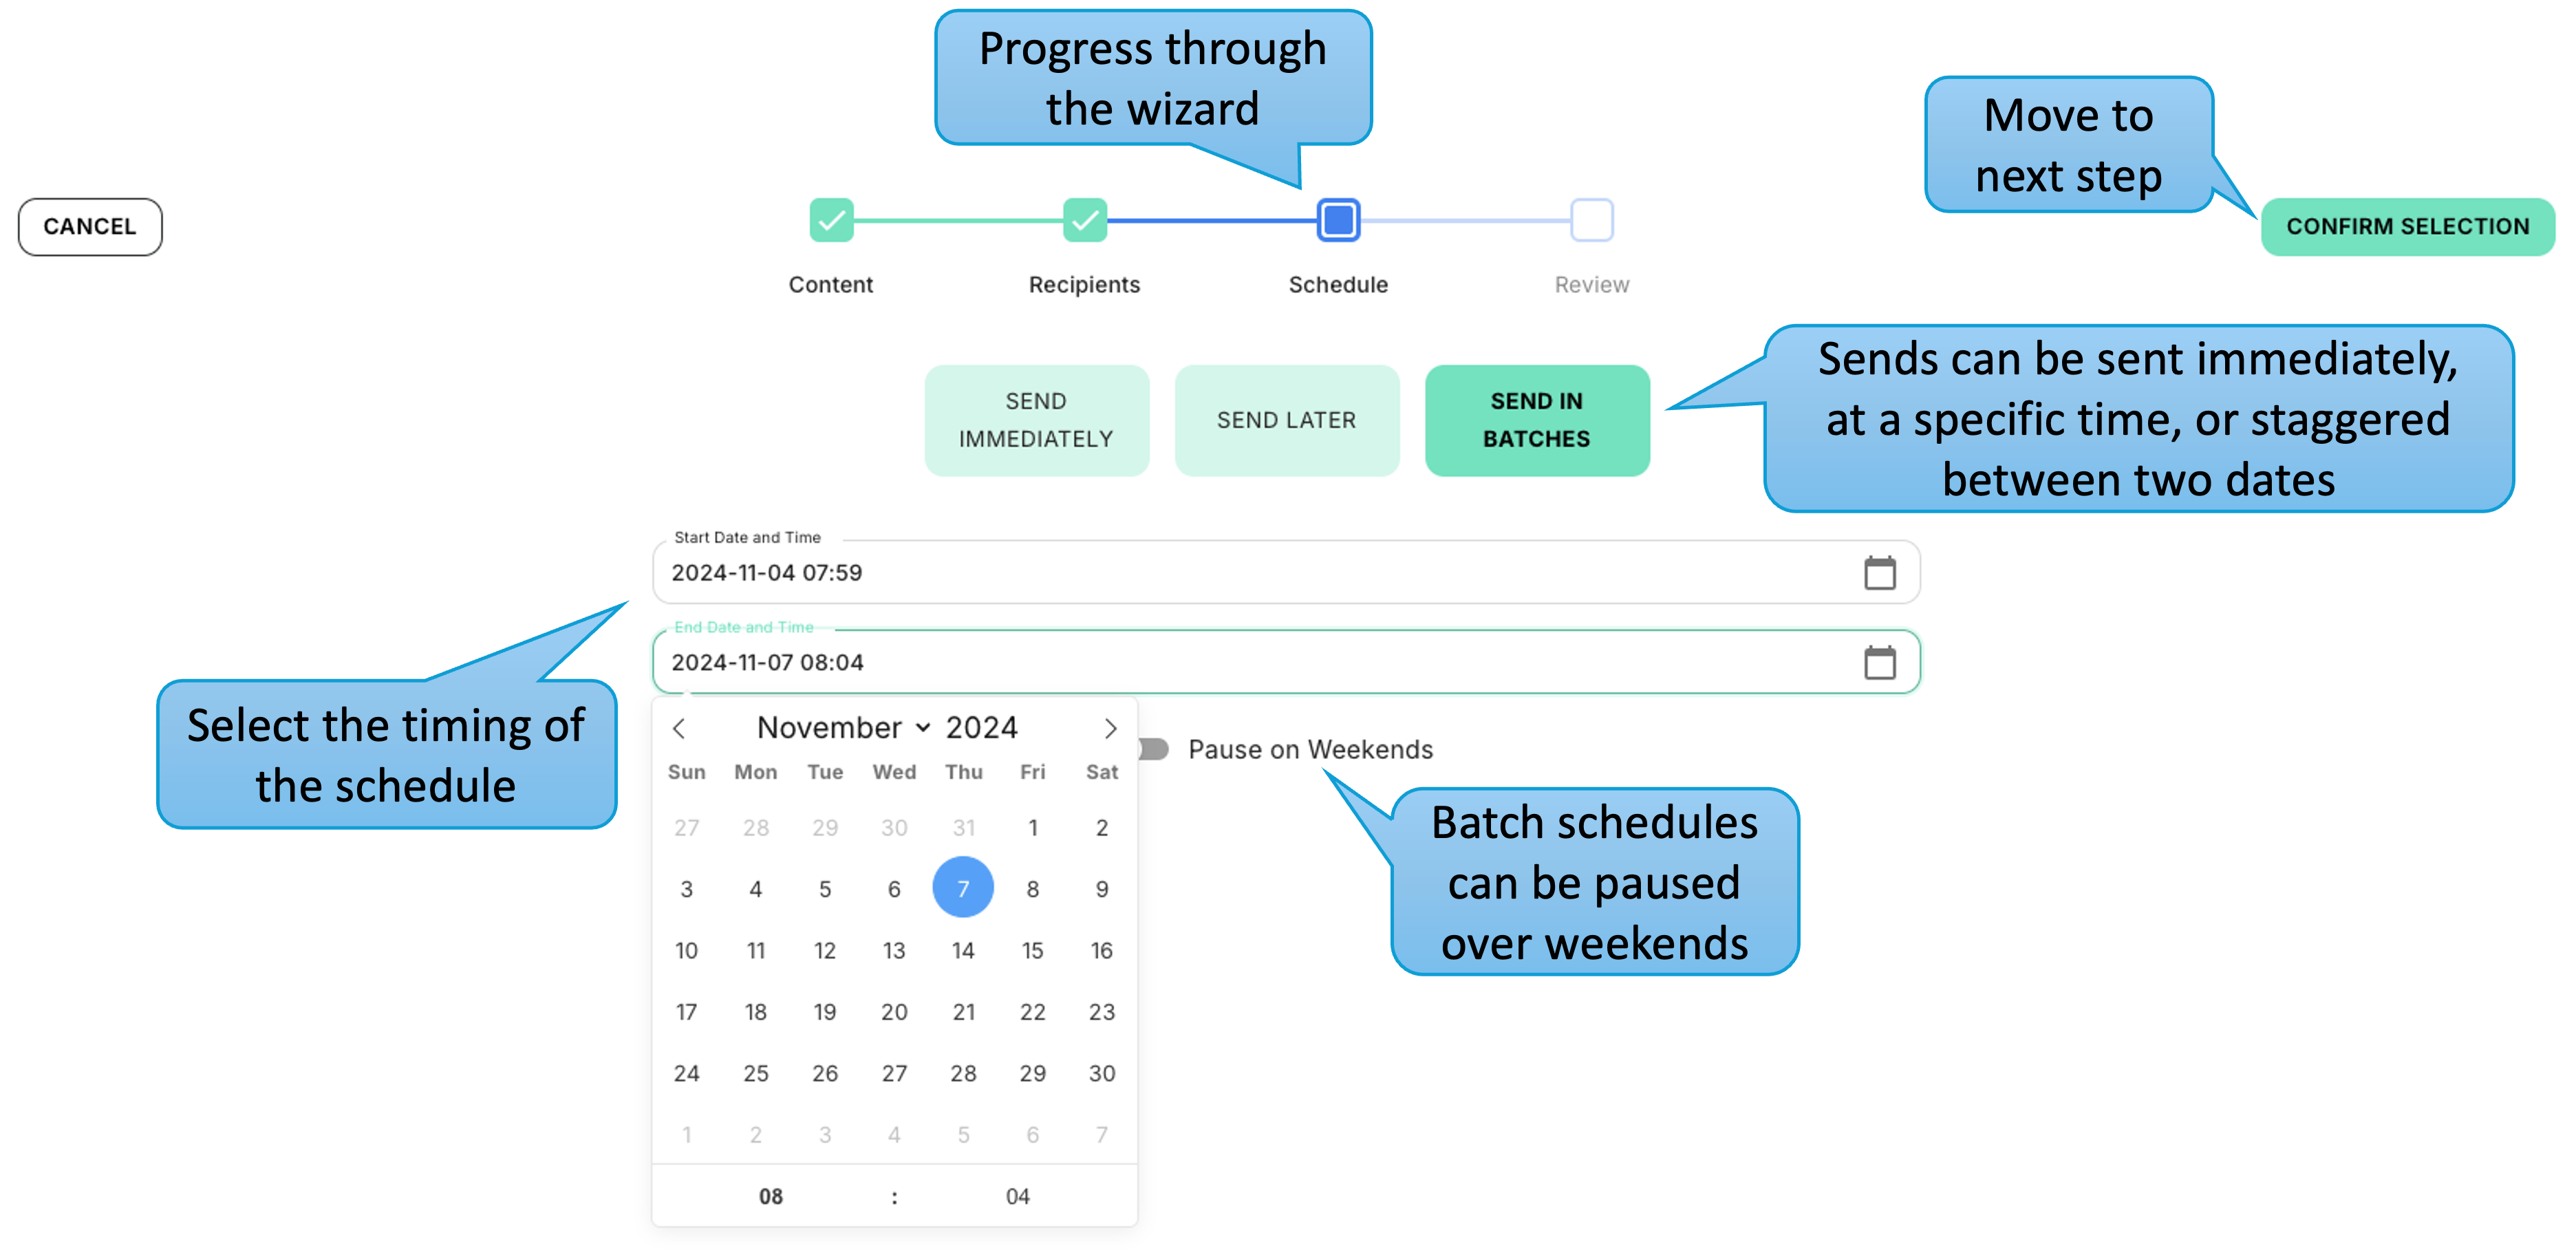
Step 3 is to select the timing of the send from three options. This can be sent immediately, at a future date or spread out in batches between two dates. Where sends are spread over more than a week they can be paused at weekends as required.
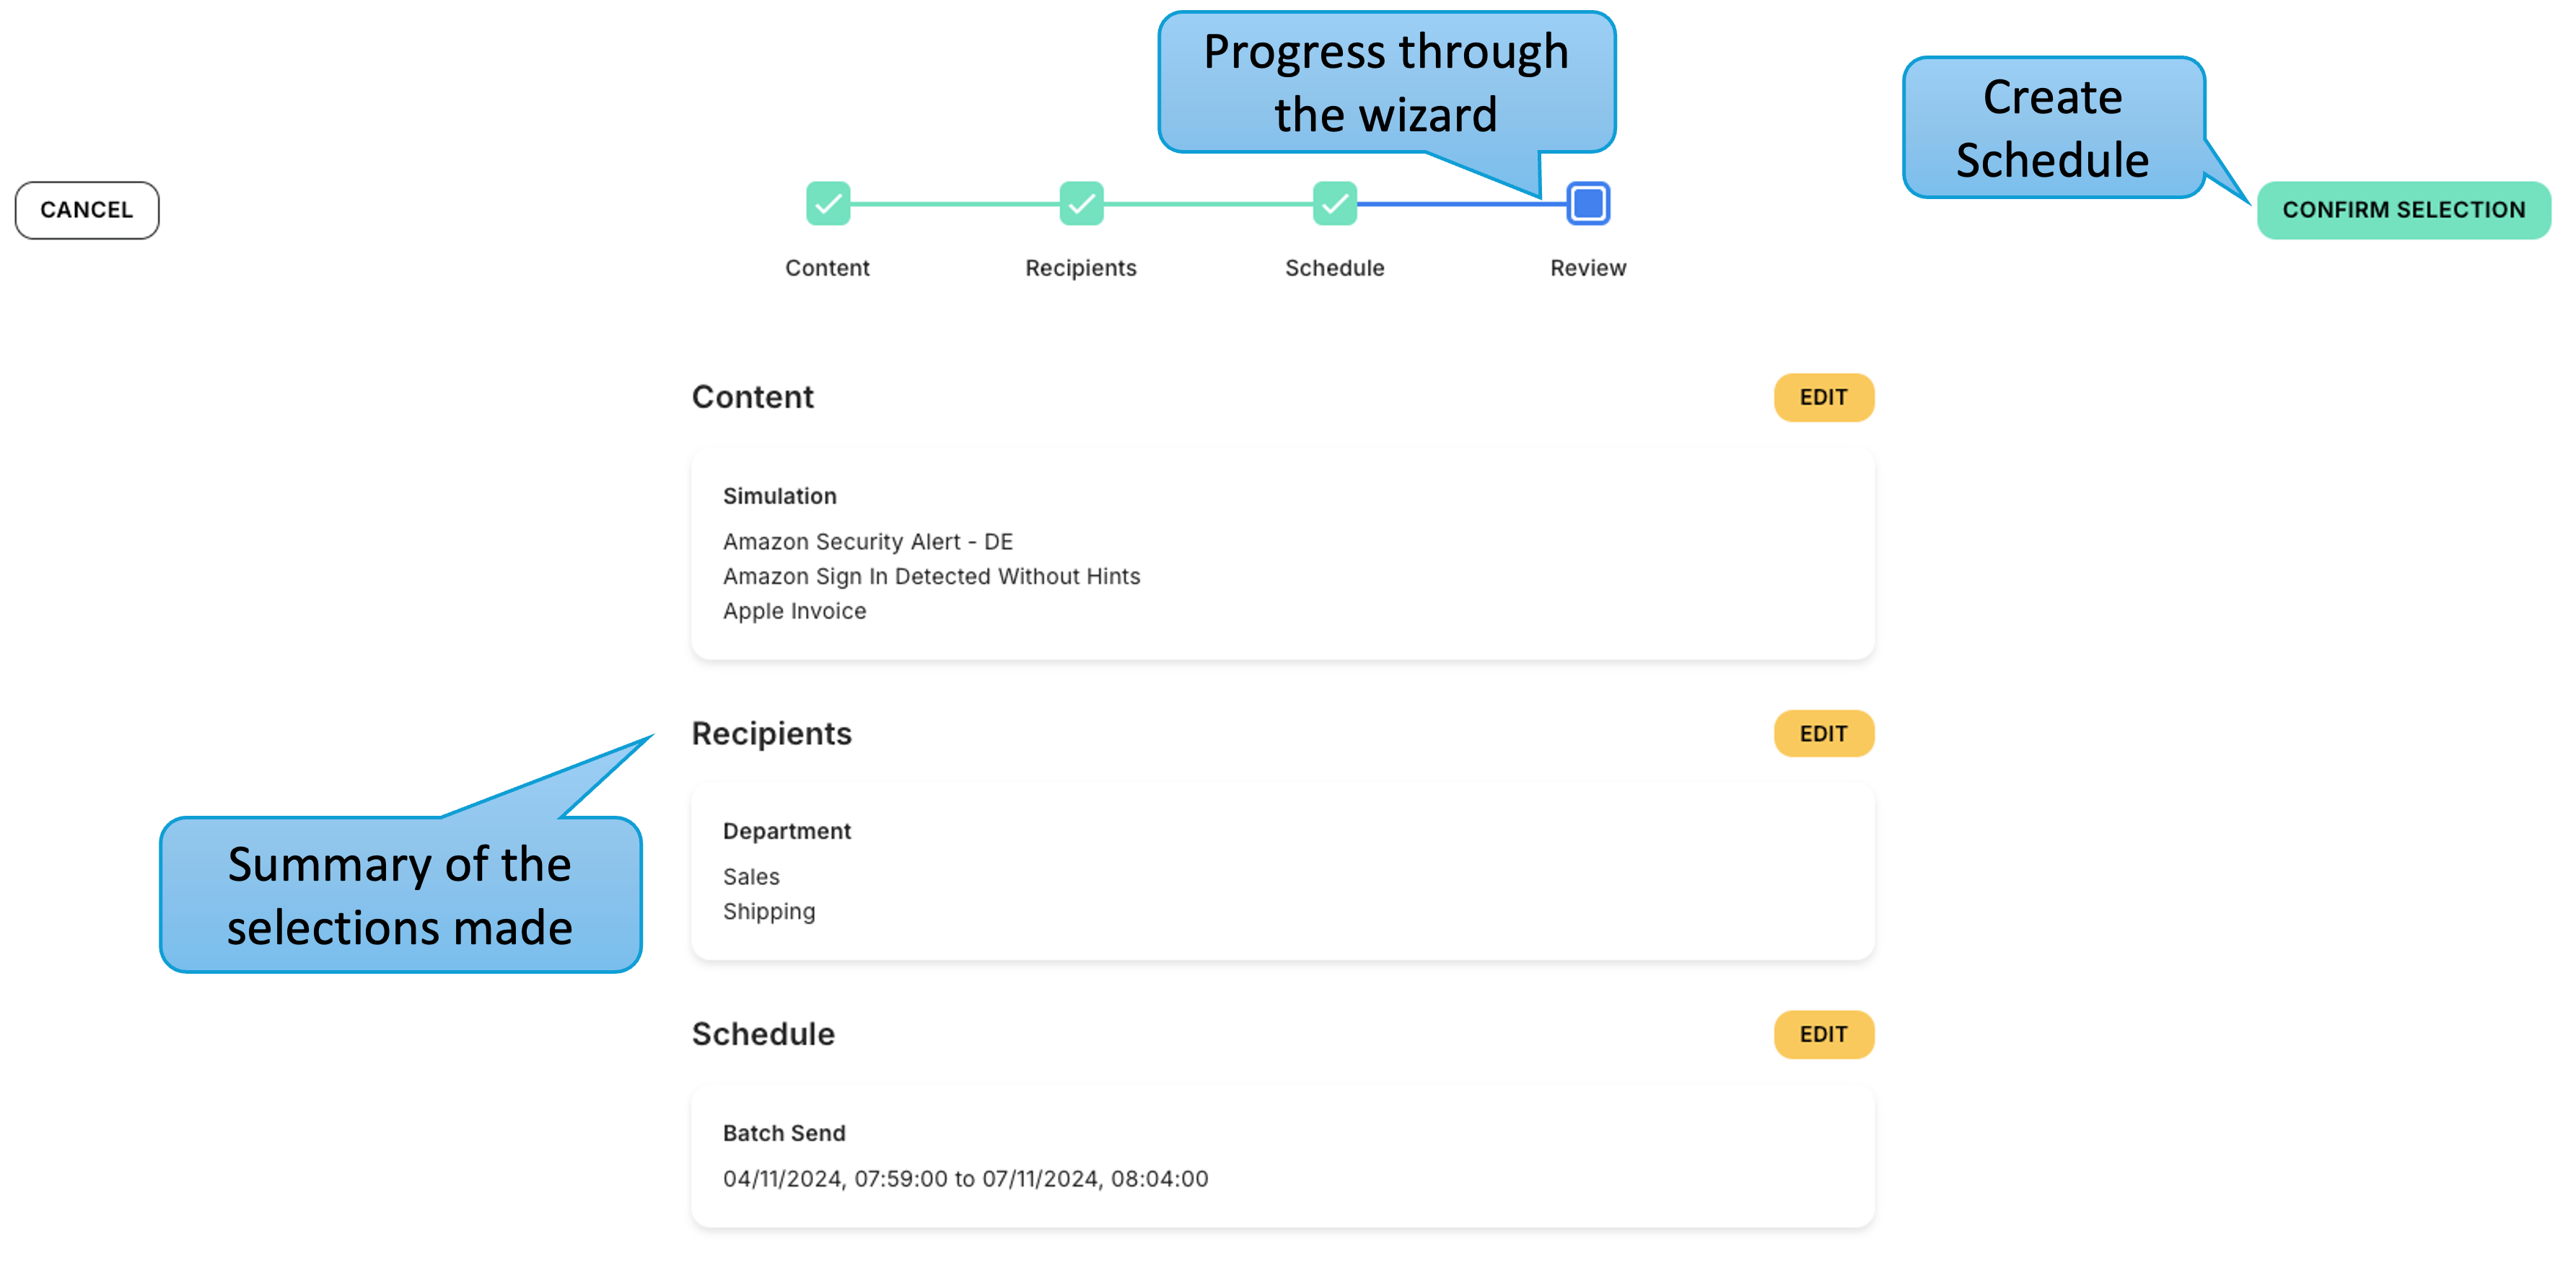
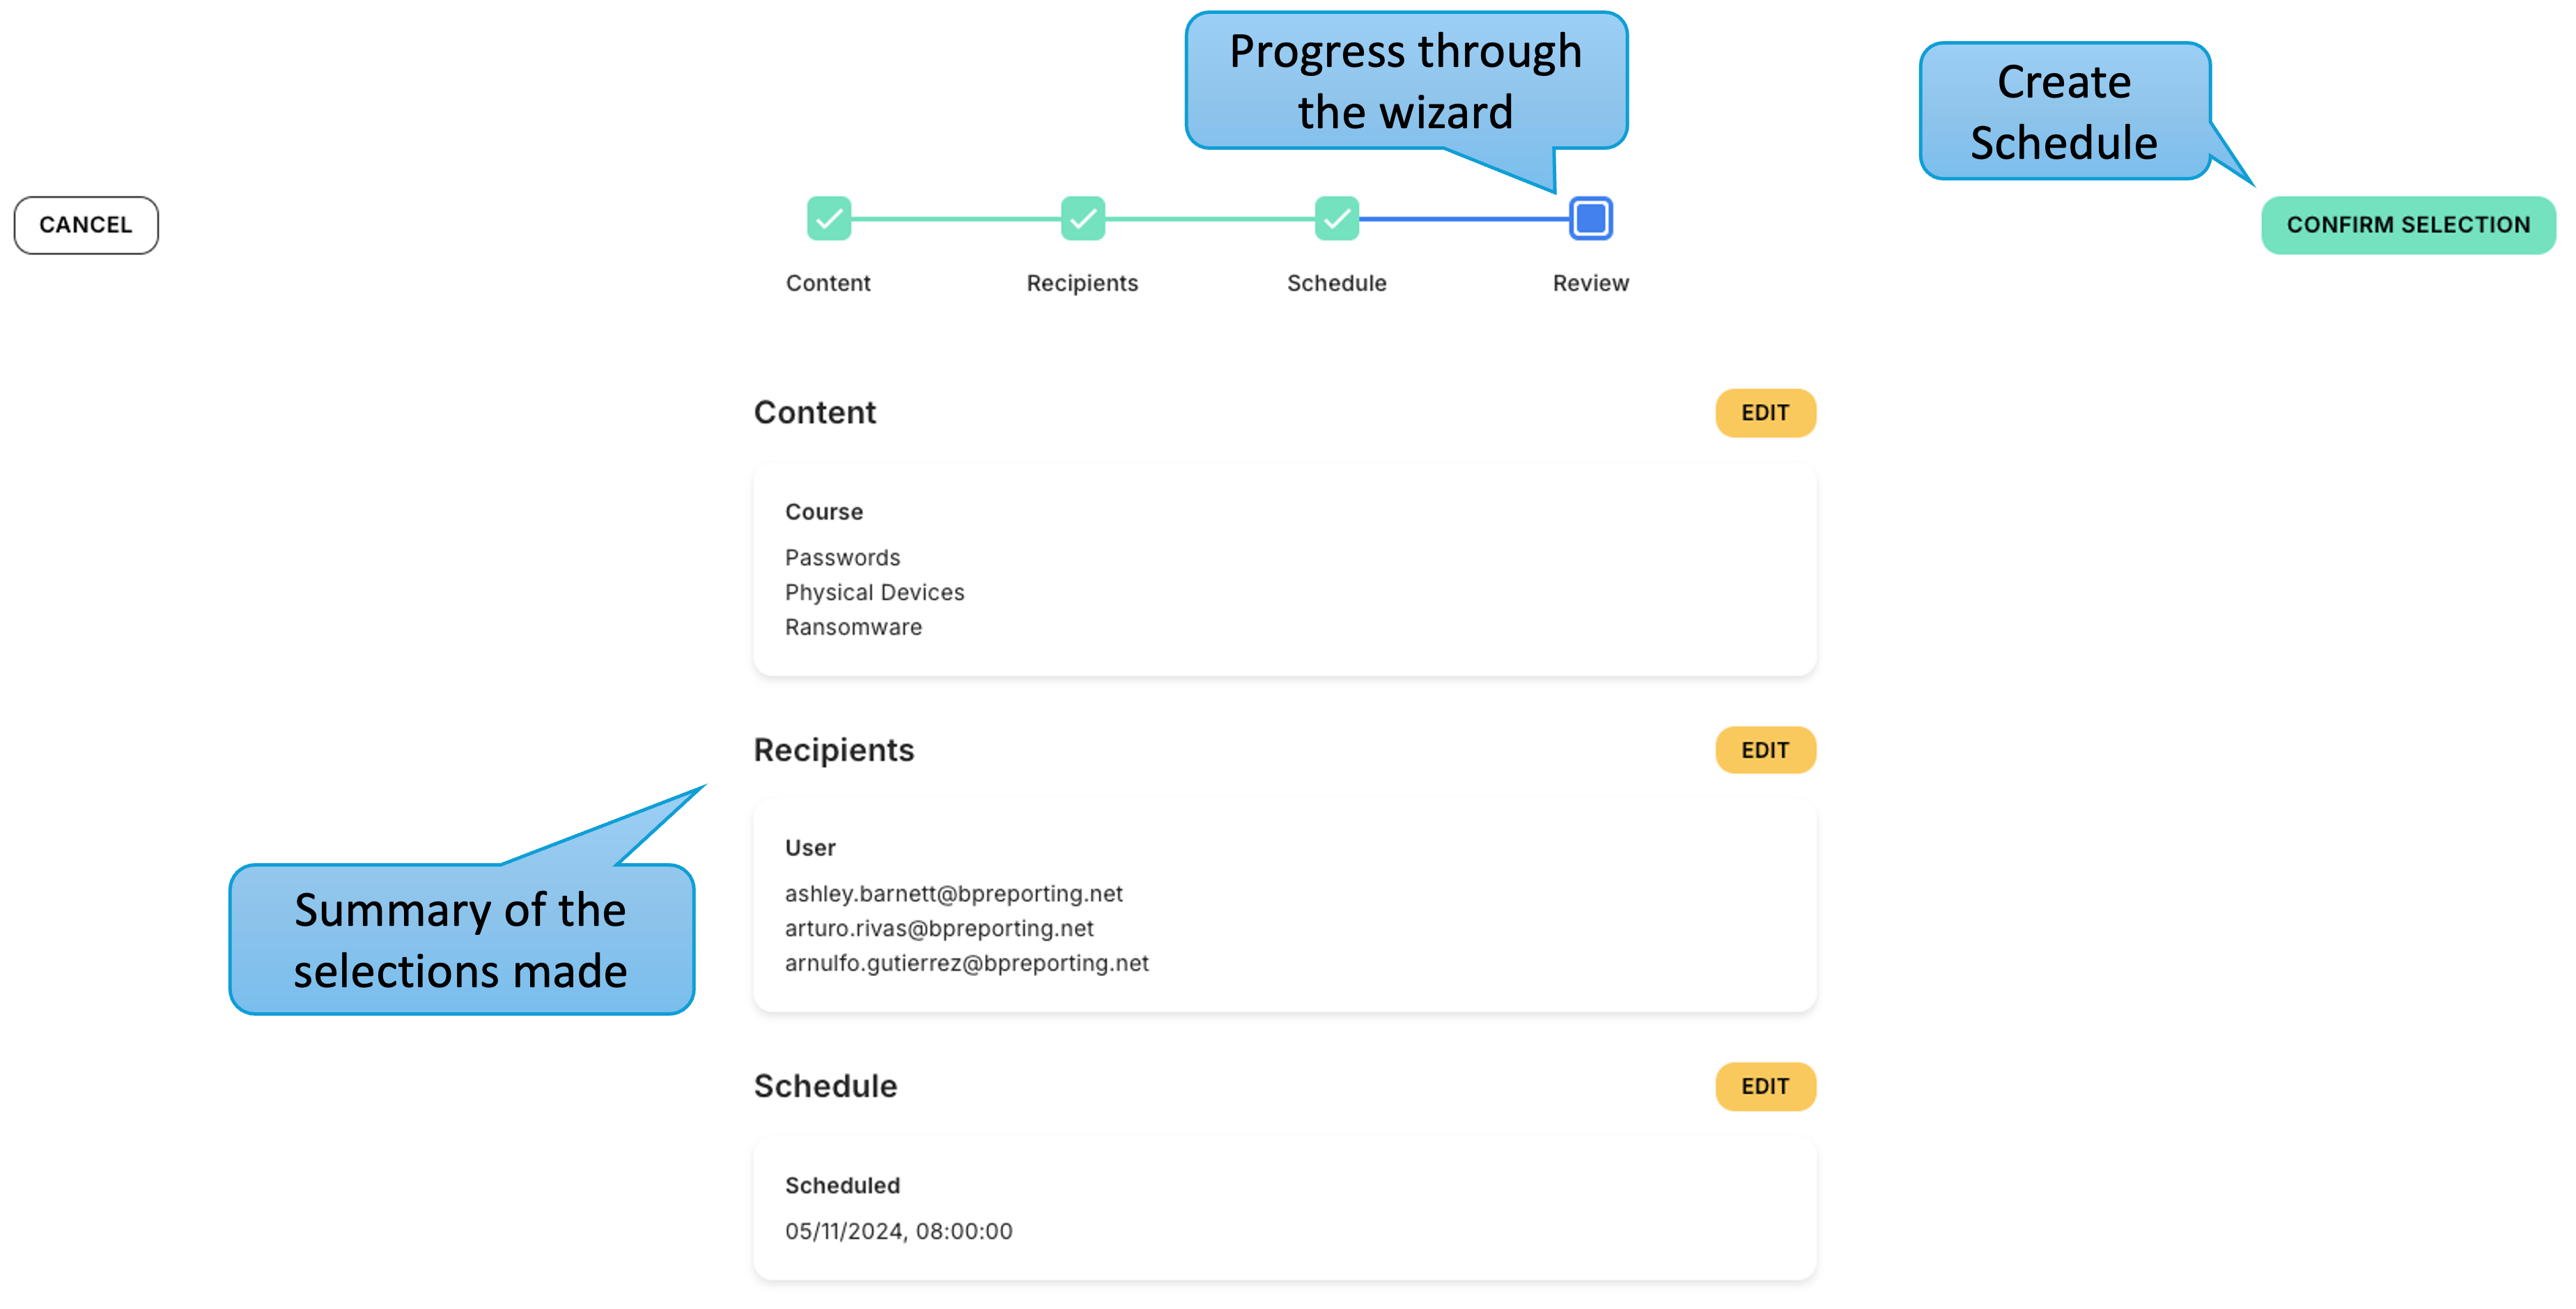
The final step is a simple summary of the configuration completed in the previous steps.
Sending a Course
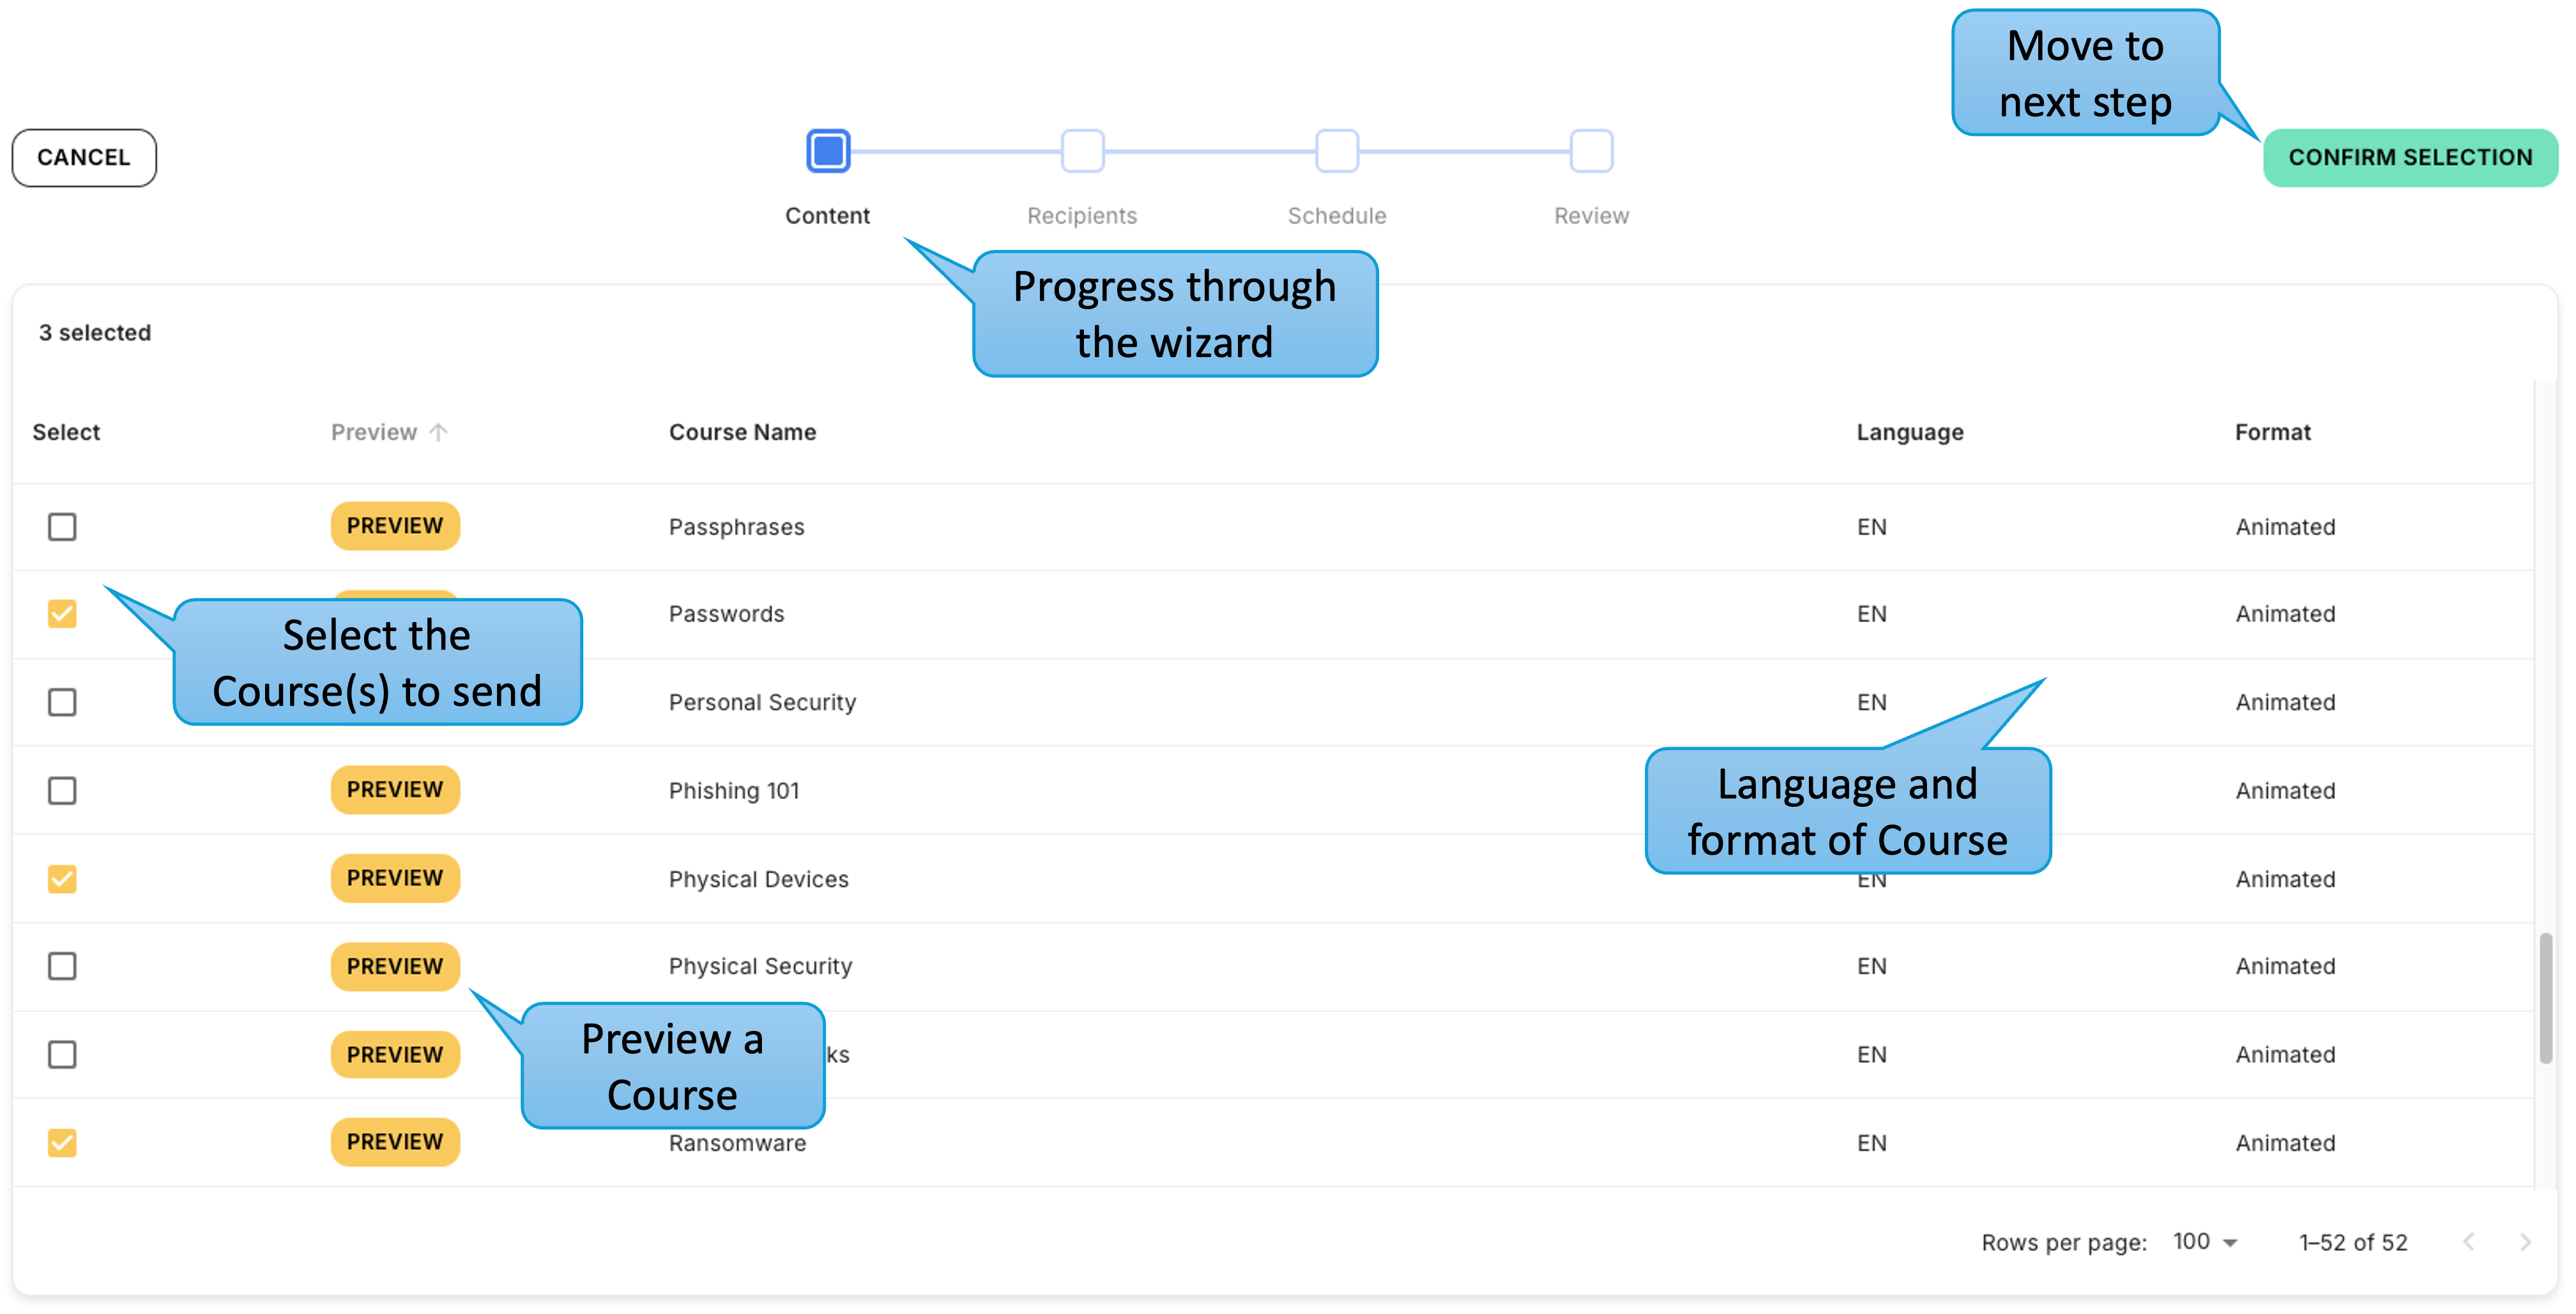
After clicking the 'Course' button the user is taken to a simple 4 step wizard to create a scheduled send as shown below. From here the user can select one or more Courses to be included in the schedule from the library of available Courses. The table provides details of the Courses and the ability to 'Preview' the Course.
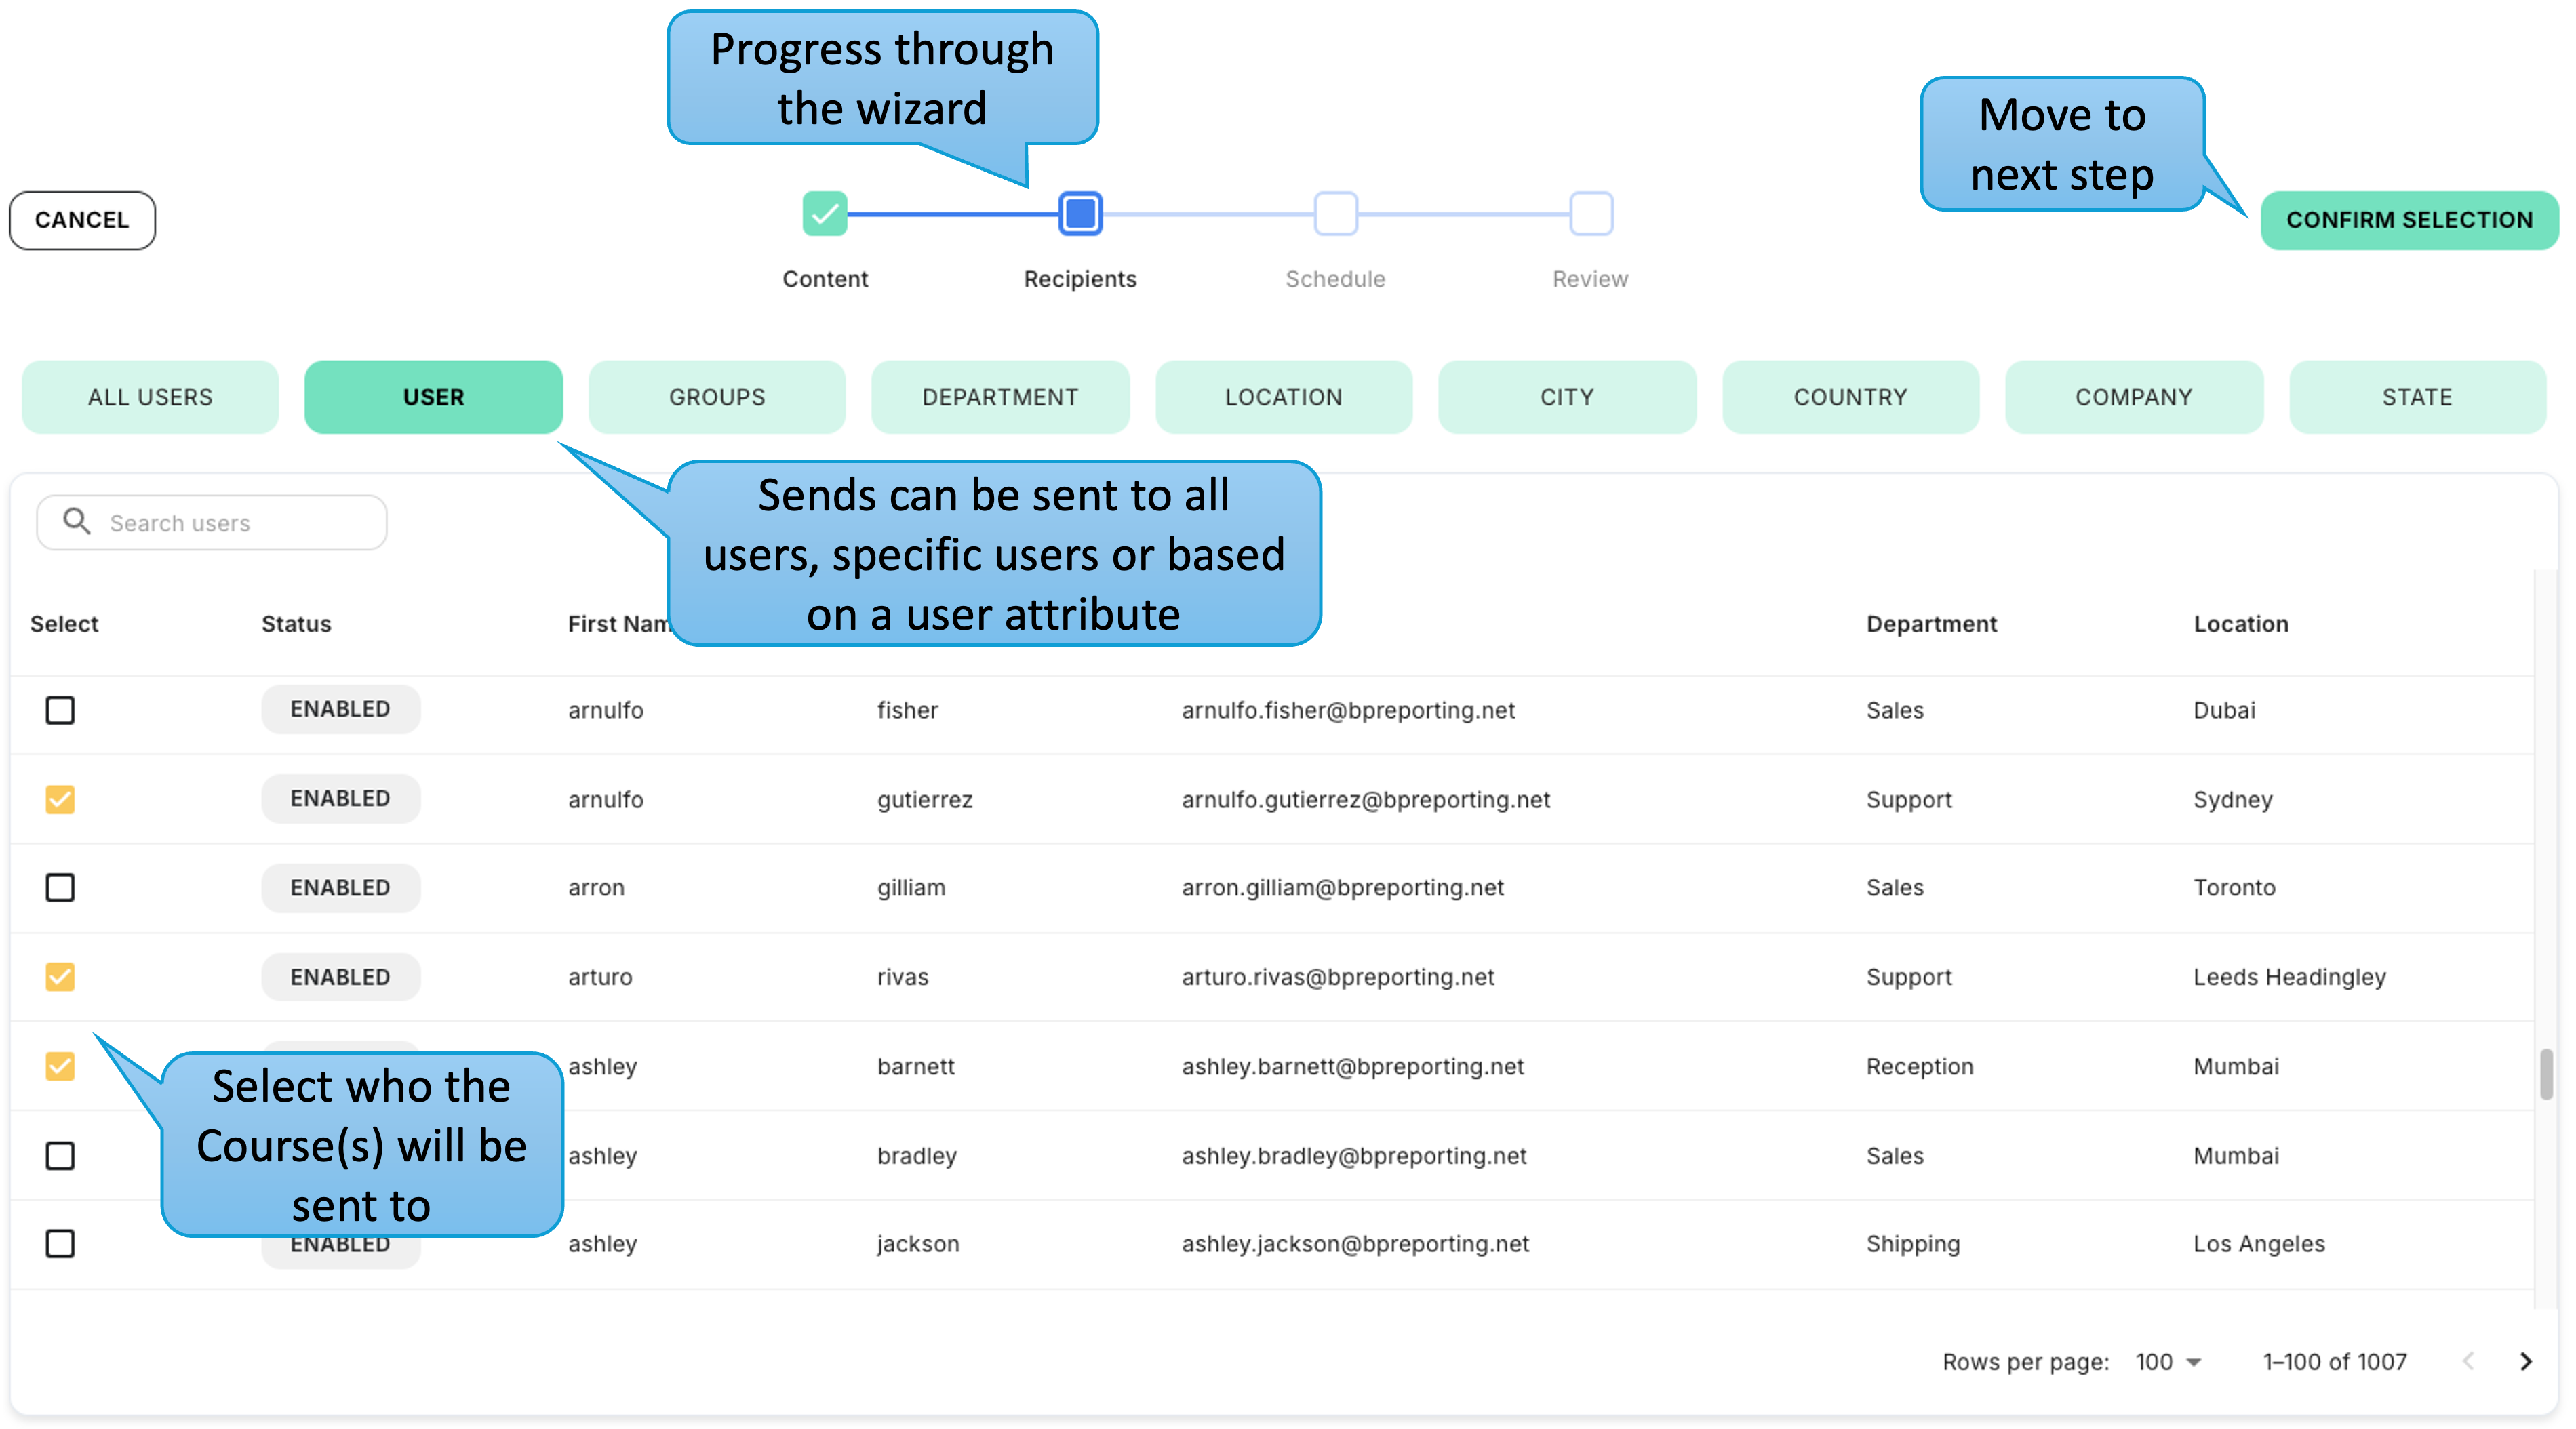
Once the Courses have been selected by clicking the 'Confirm Selection' button the user can choose the recipients. This can be to all users, explicitly chosen users or based on user attributes, such as User Group or Department as shown below.
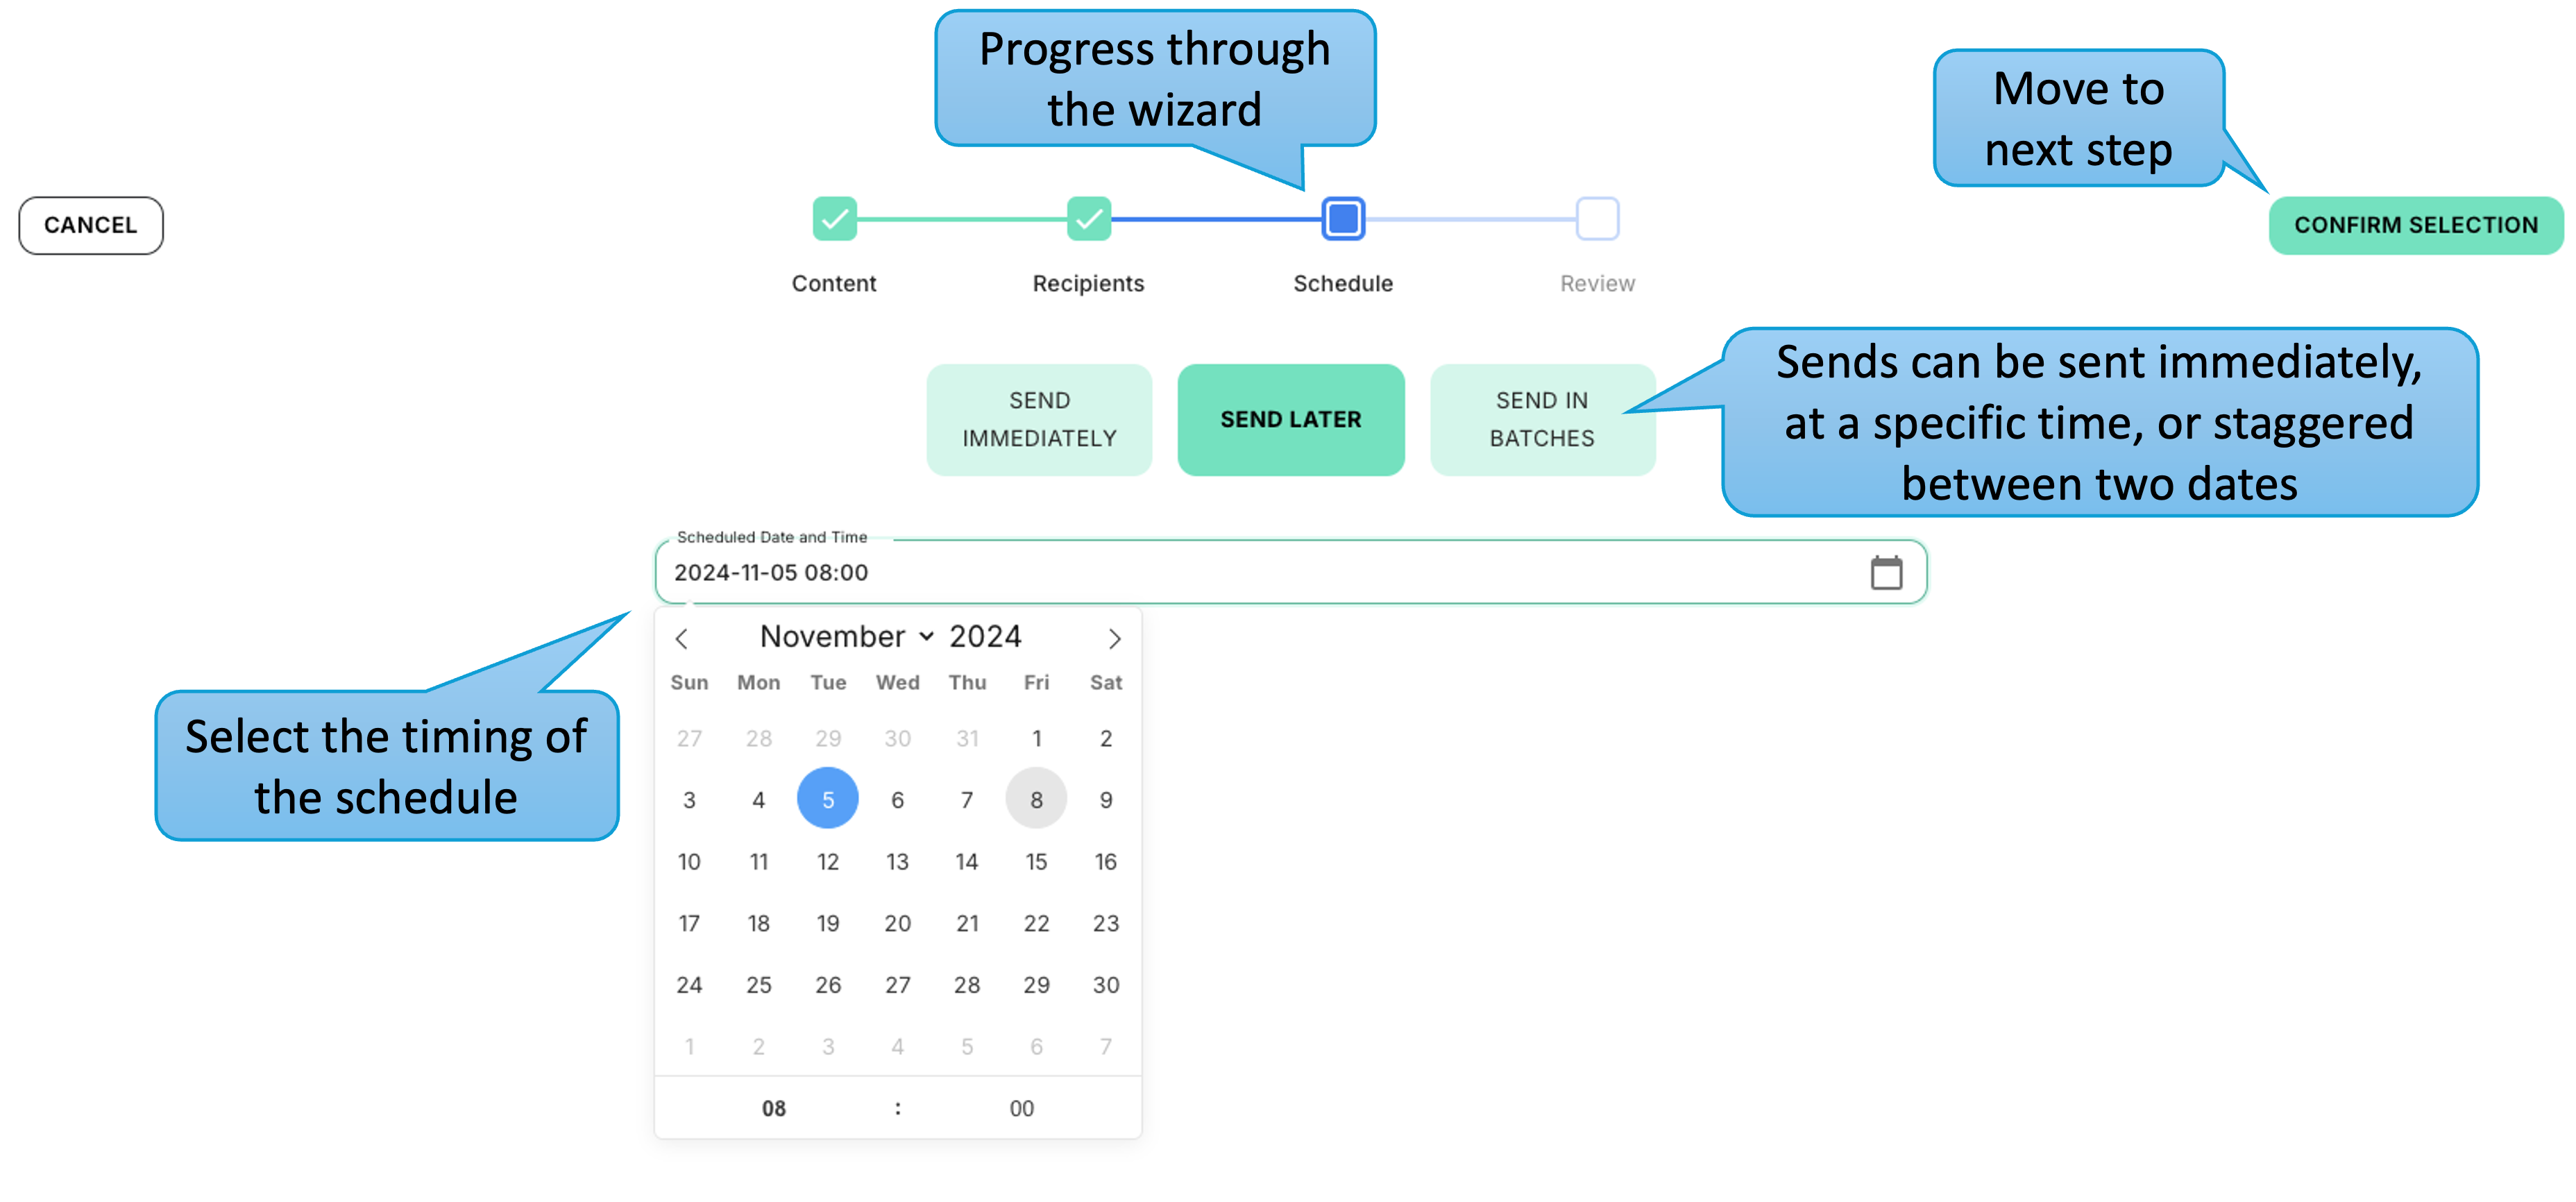
Step 3 is to select the timing of the send from three options. This can be sent immediately, at a future date or spread out in batches between two dates. Where sends are spread over more than a week they can be paused at weekends as required.
The final step is a simple summary of the configuration completed in the previous steps.
History
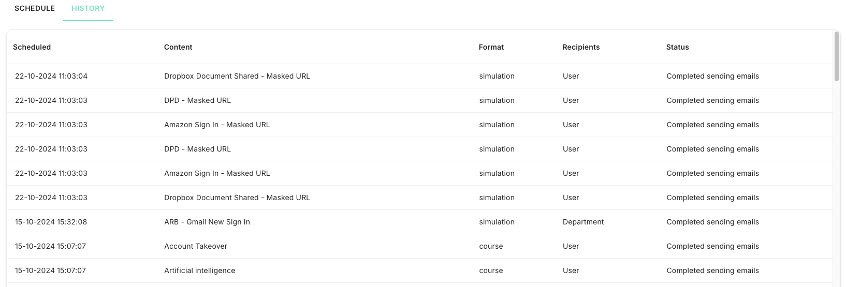
The History tab shows a log of previous 'On Demand' sends across both Simulations and Courses and the status of each. The image below shows an example.
Reports
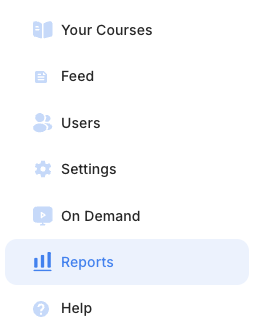
By selecting the 'Reports' option in the left hand menu, shown below, an administrator, or user with elevated access, can view a dashboard with various visualisations showing how users are performing in relation to both Courses and Simulations. The dashboard is split into five tabs; 'Summary', 'Simulations', 'Courses', 'Audit Report' and 'Meta Data'. This section of the guide will run through each in turn.
Summary
The 'Summary' tab provides high-level metrics for all users, including a Risk Score, Number of Users, % Failed for Simulations, % Failed for Courses, the Average Score on Courses and the Risk Score over time.
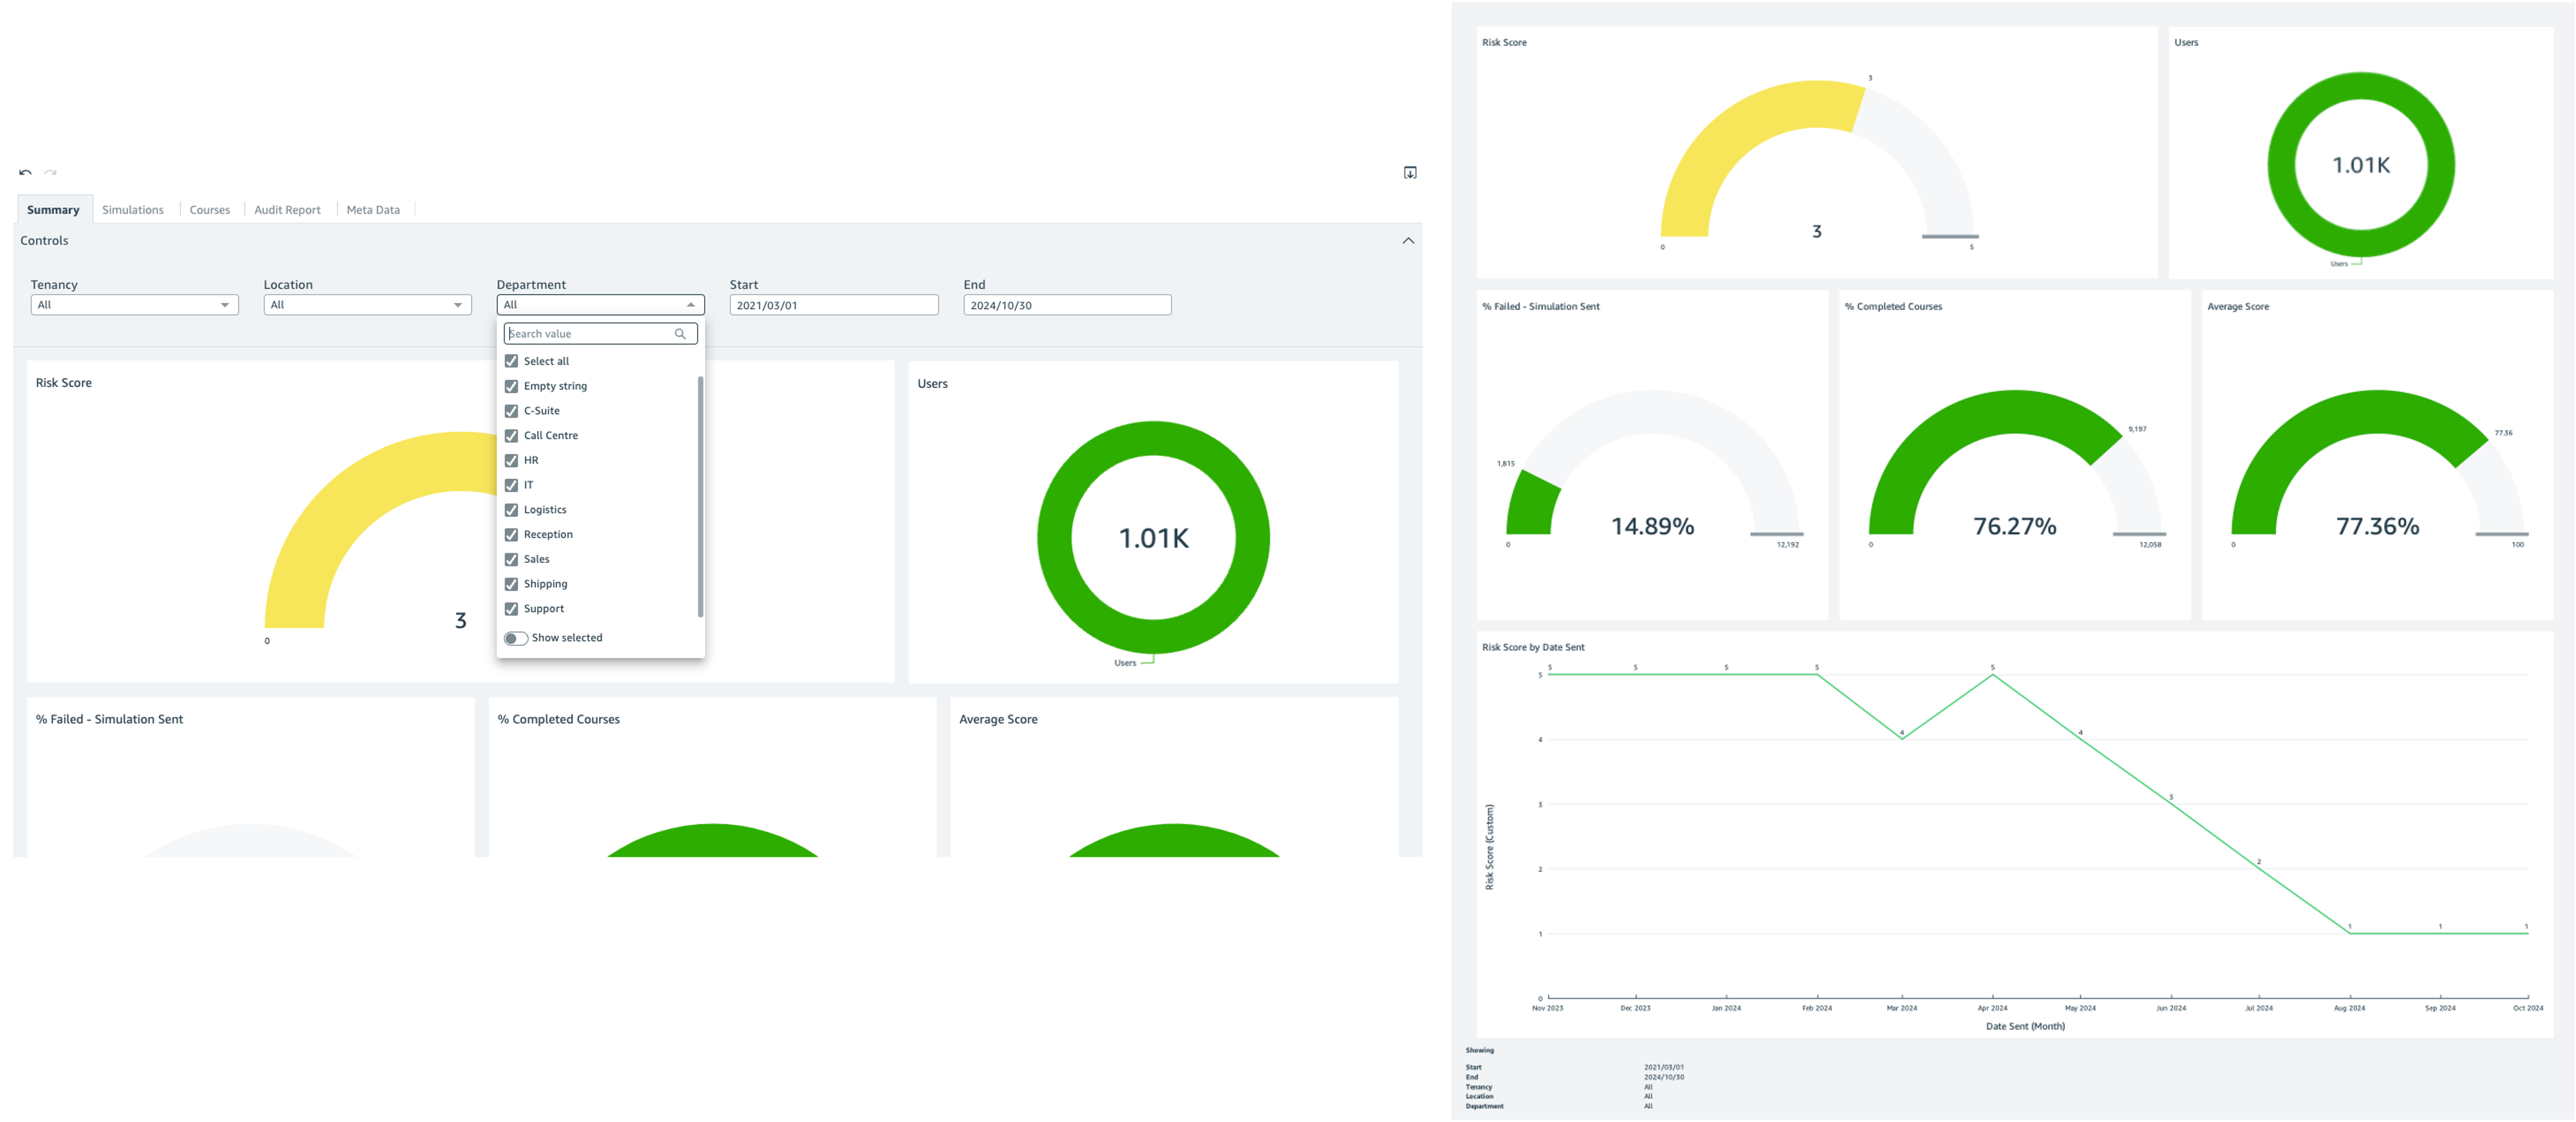
The 'Risk Score' is calculated based on the following:
- Calculated on % of Simulations clicked
- Risk Score 5 - over 20%
- Risk Score 4 - over 15% and under 20%
- Risk Score 3 - over 10% and under 15%
- Risk Score 2 - over 5% and under 9.999%
- Risk Score 1 - Below 5%
Simulations
The 'Simulations' tab provides more detail on how users are engaging with Simulations specifically. The dashboard contains various visualisations slicing the data in several dimensions, including by time, Simulation and individual users. Filters can be applied to drill in further, with how to apply filters covered later in this section.
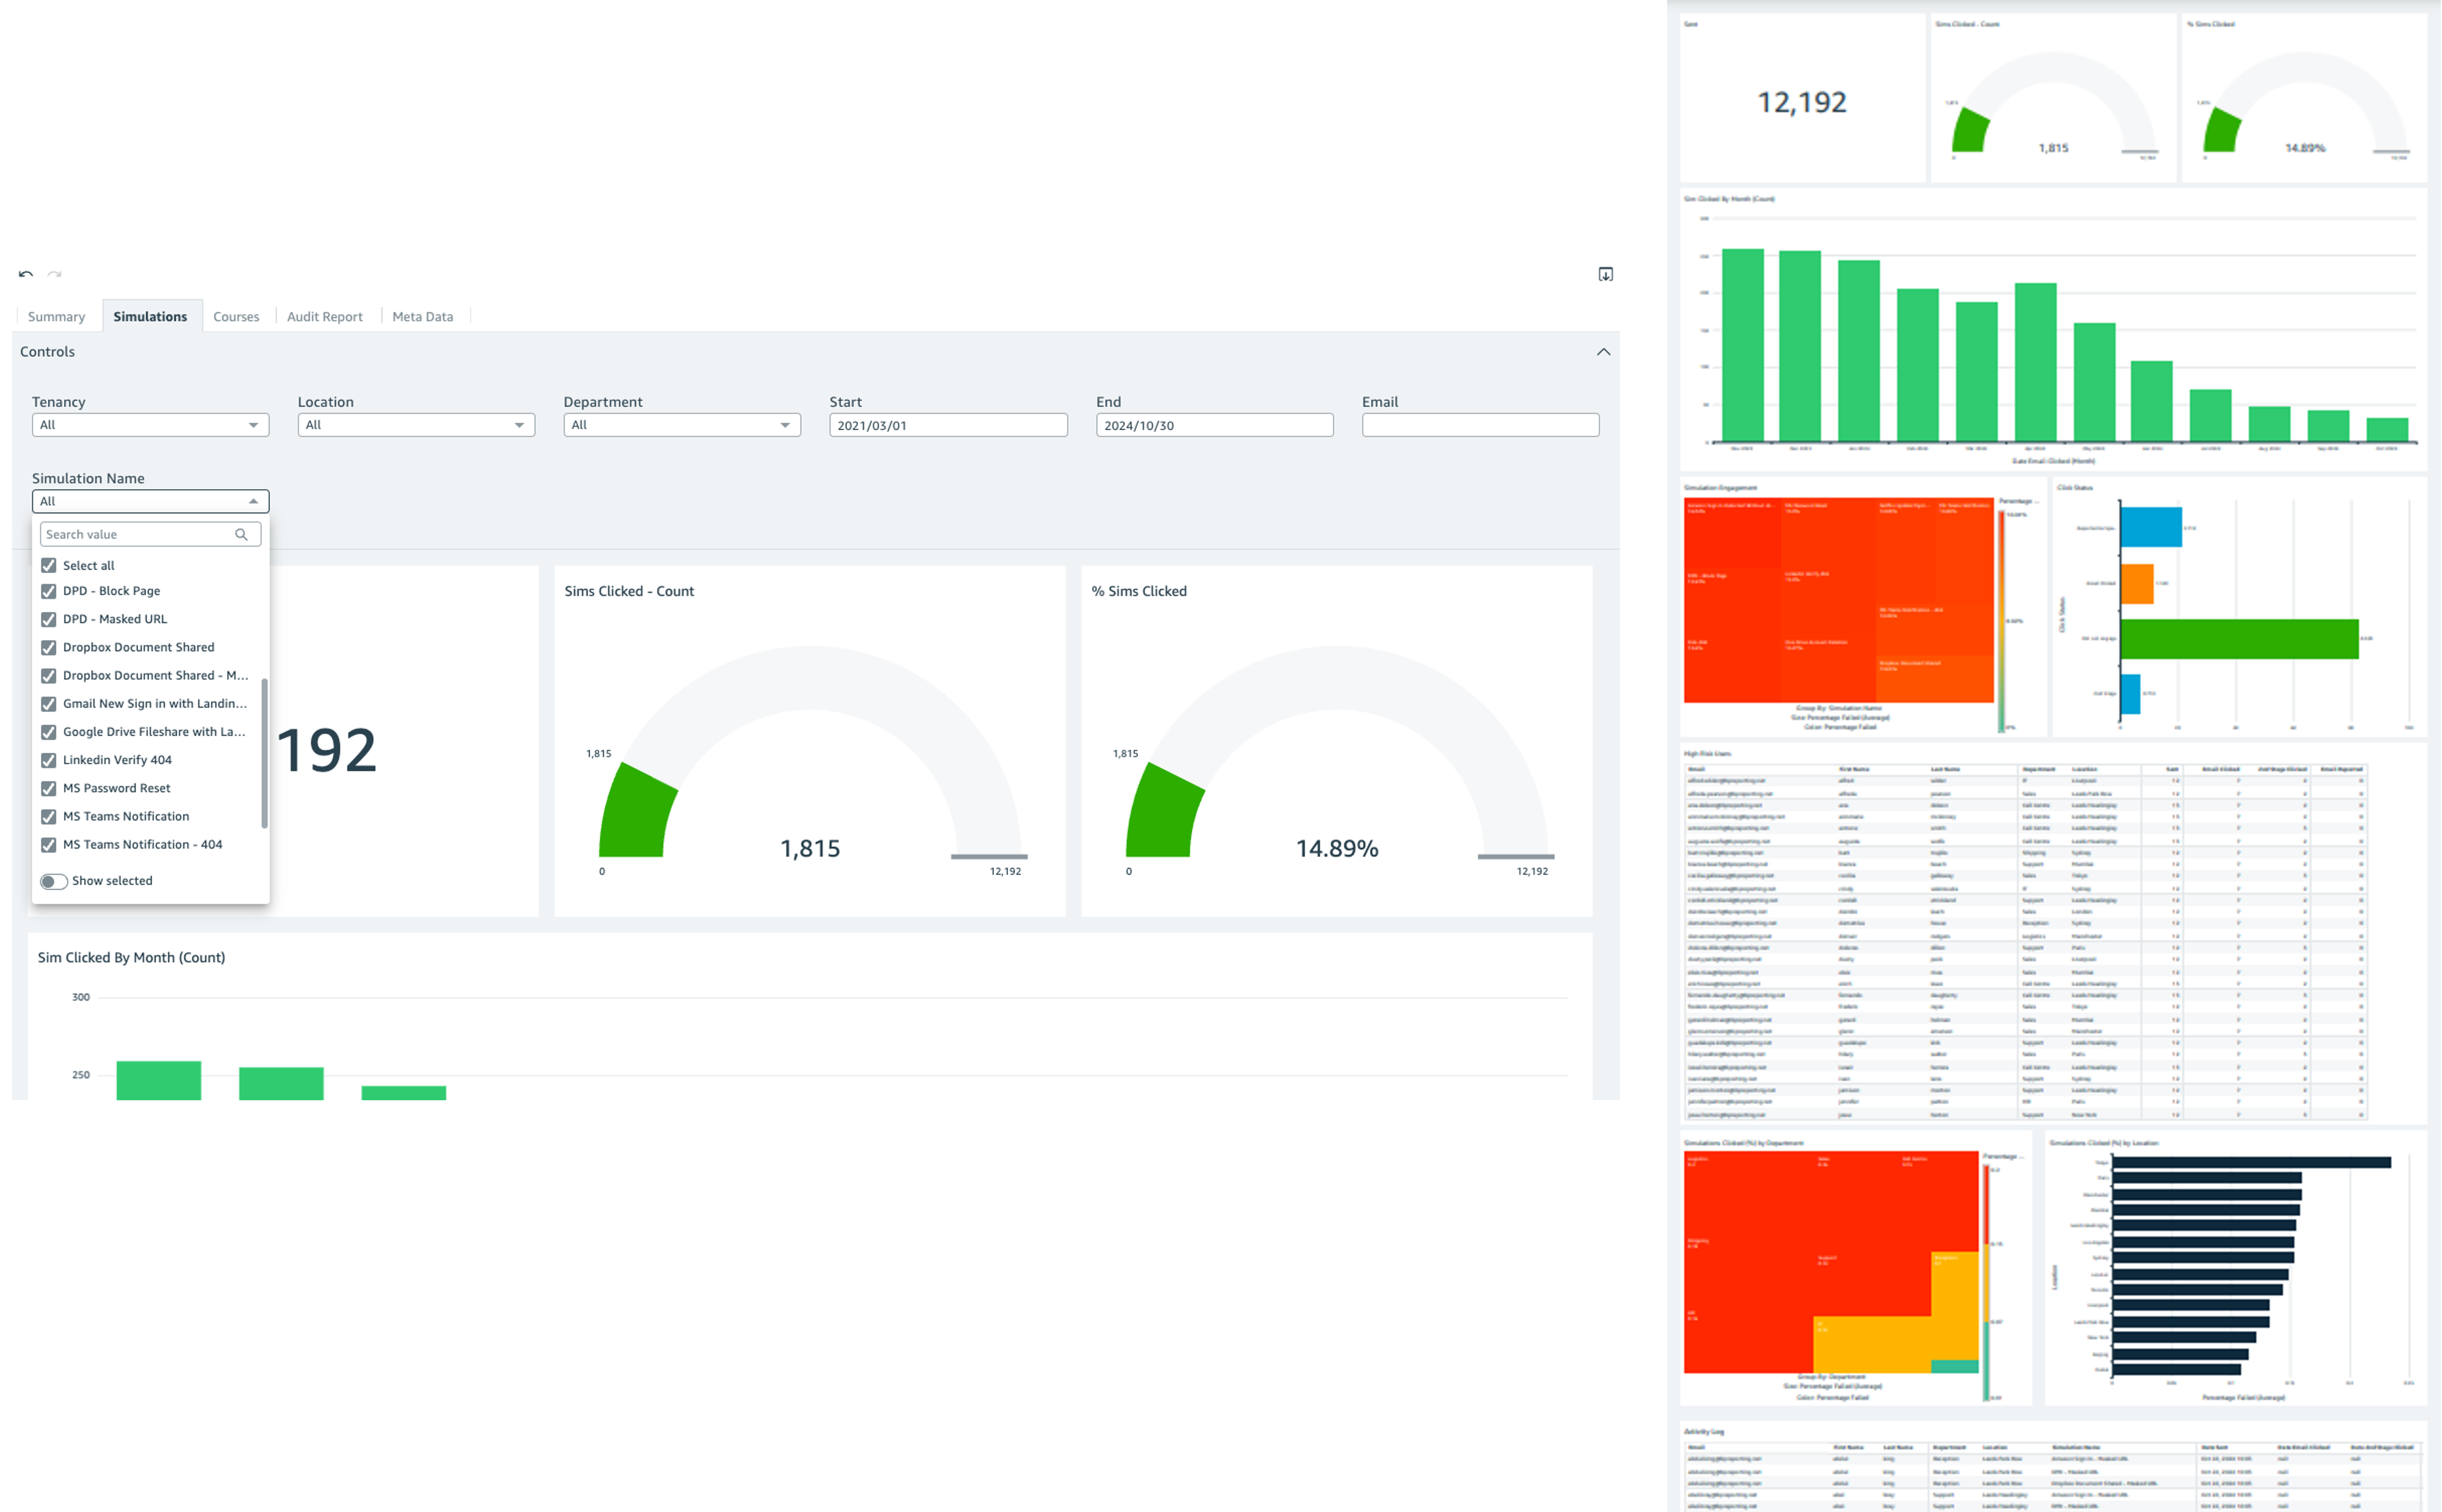
Courses
The 'Courses' tab provides more detail on how users are engaging with Courses specifically. Again the data is sliced in several dimensions, including by time, Course and individual users.
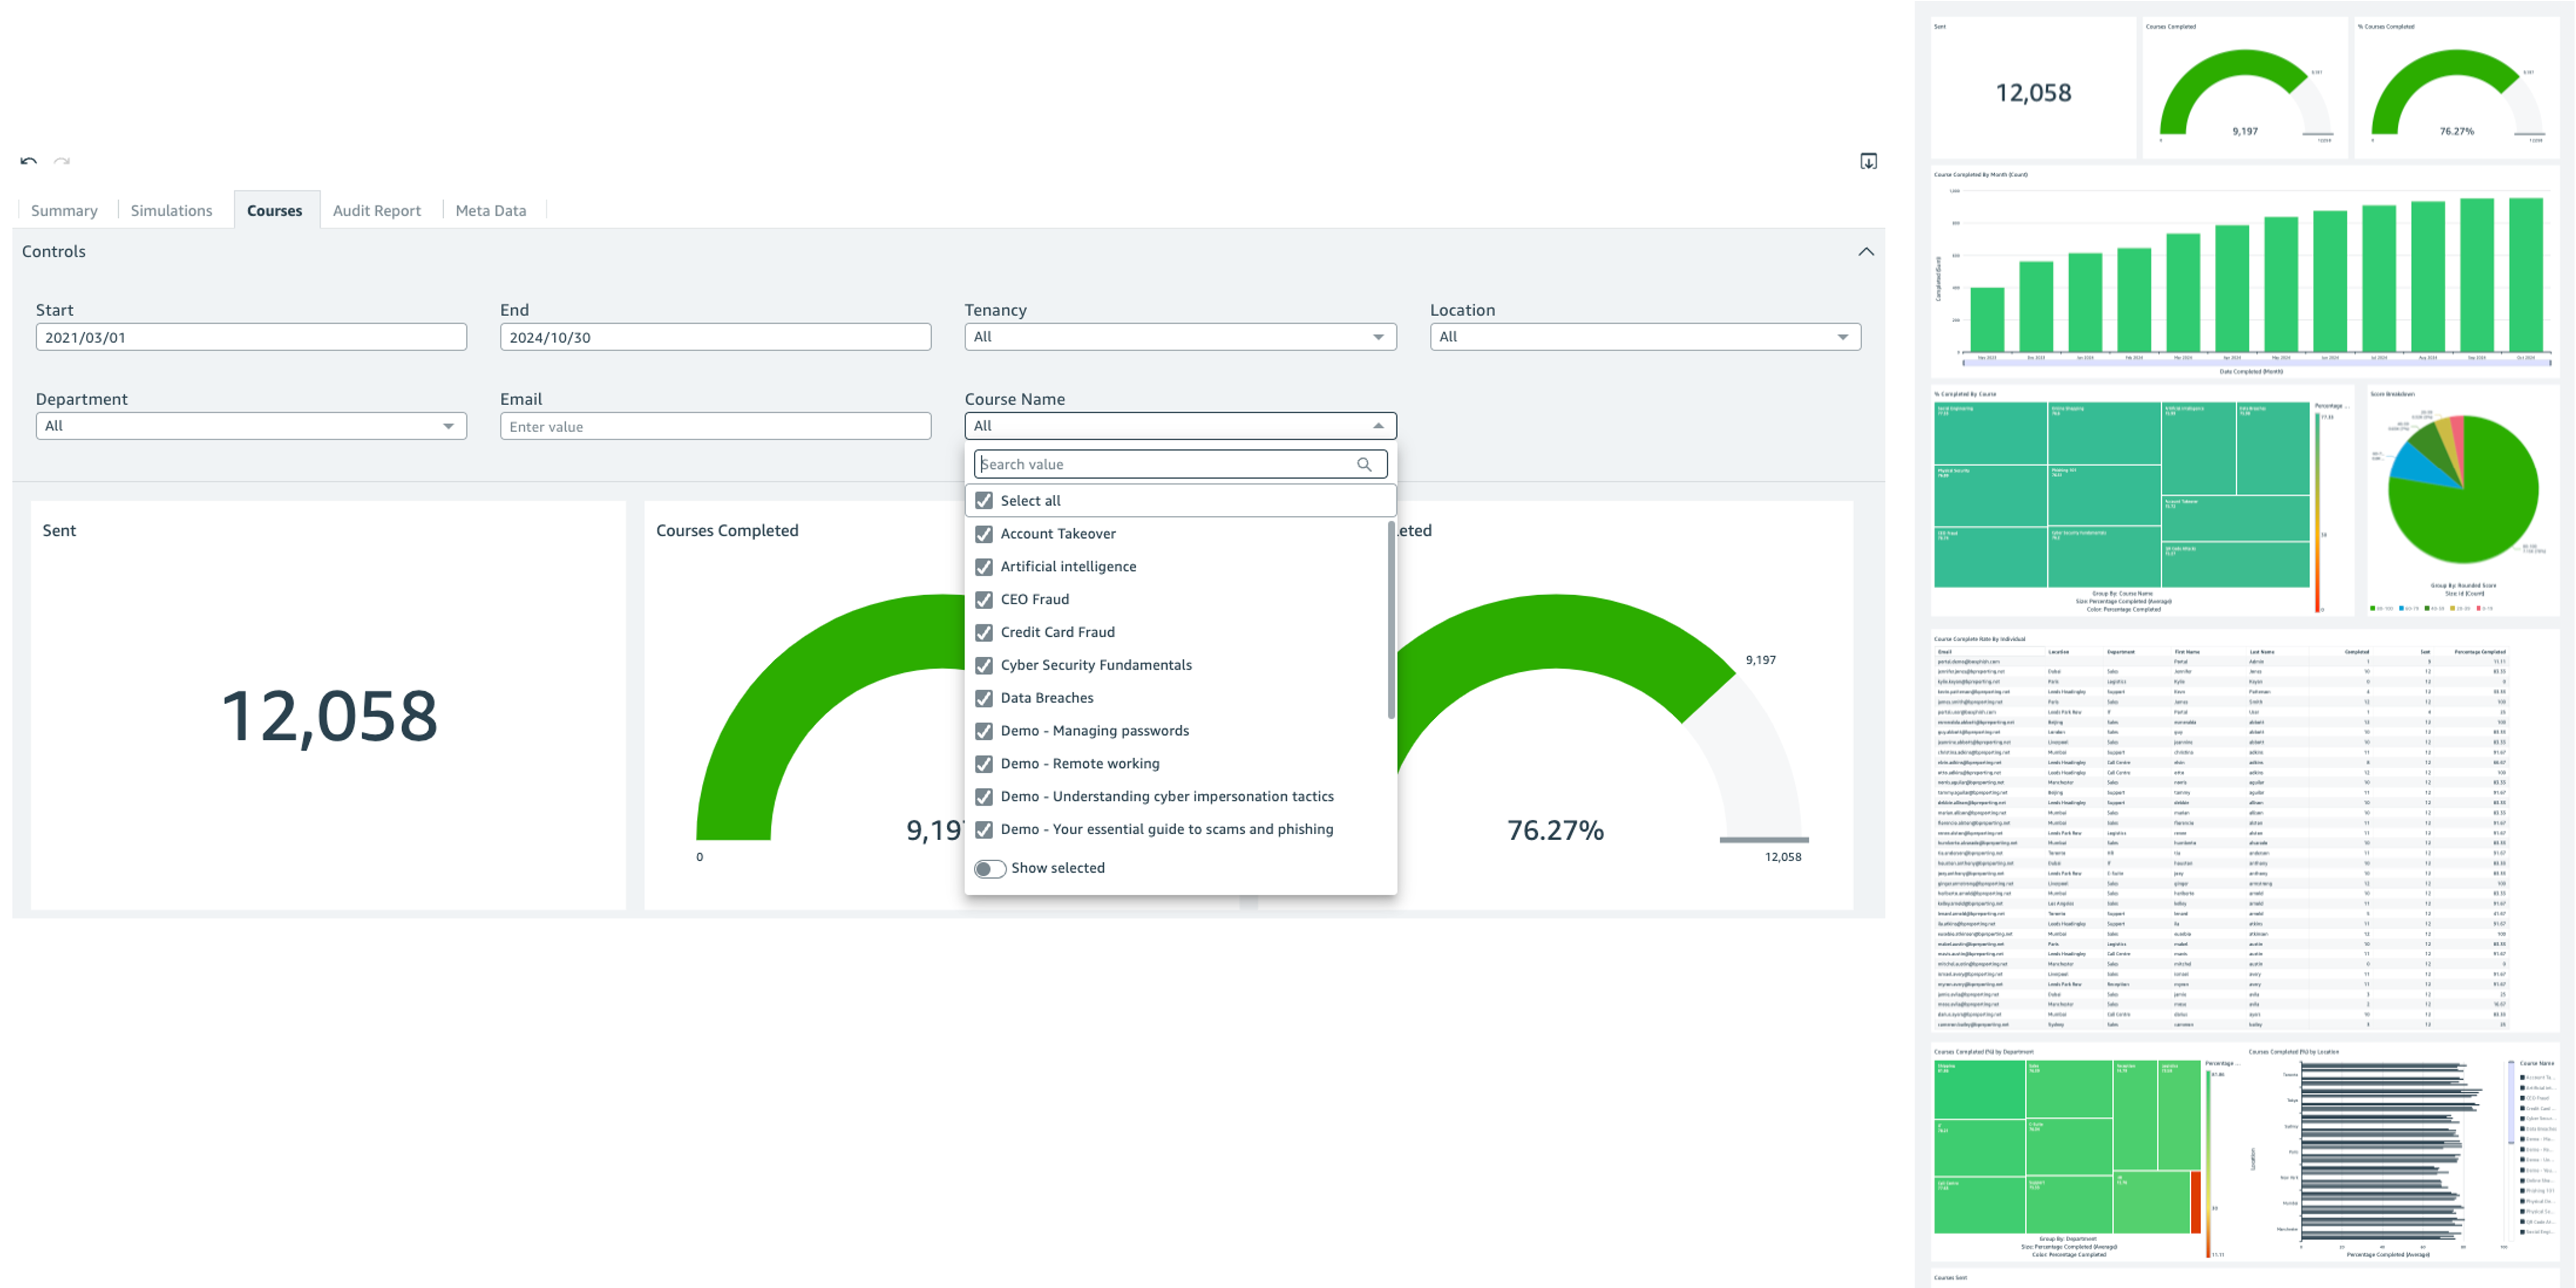
Audit Report
The 'Audit Report' tab provides a summary of all activity related to each user in turn, covering both Courses and Simulations.
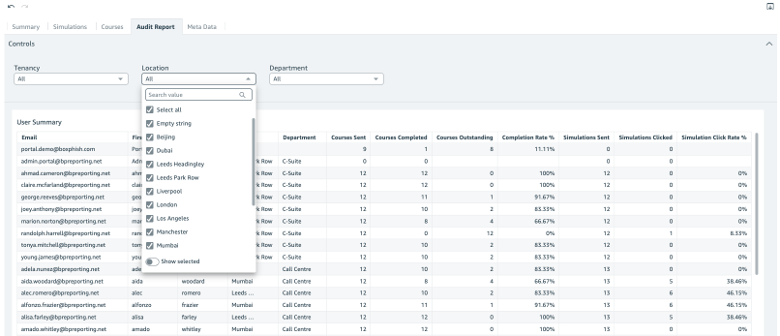
Meta Data Report
The 'Meta Data' tab provides a summary of all activity rolled up to the various user attributes available in the system, ofr example Department, again covering both Courses and Simulations.

Filtering Data
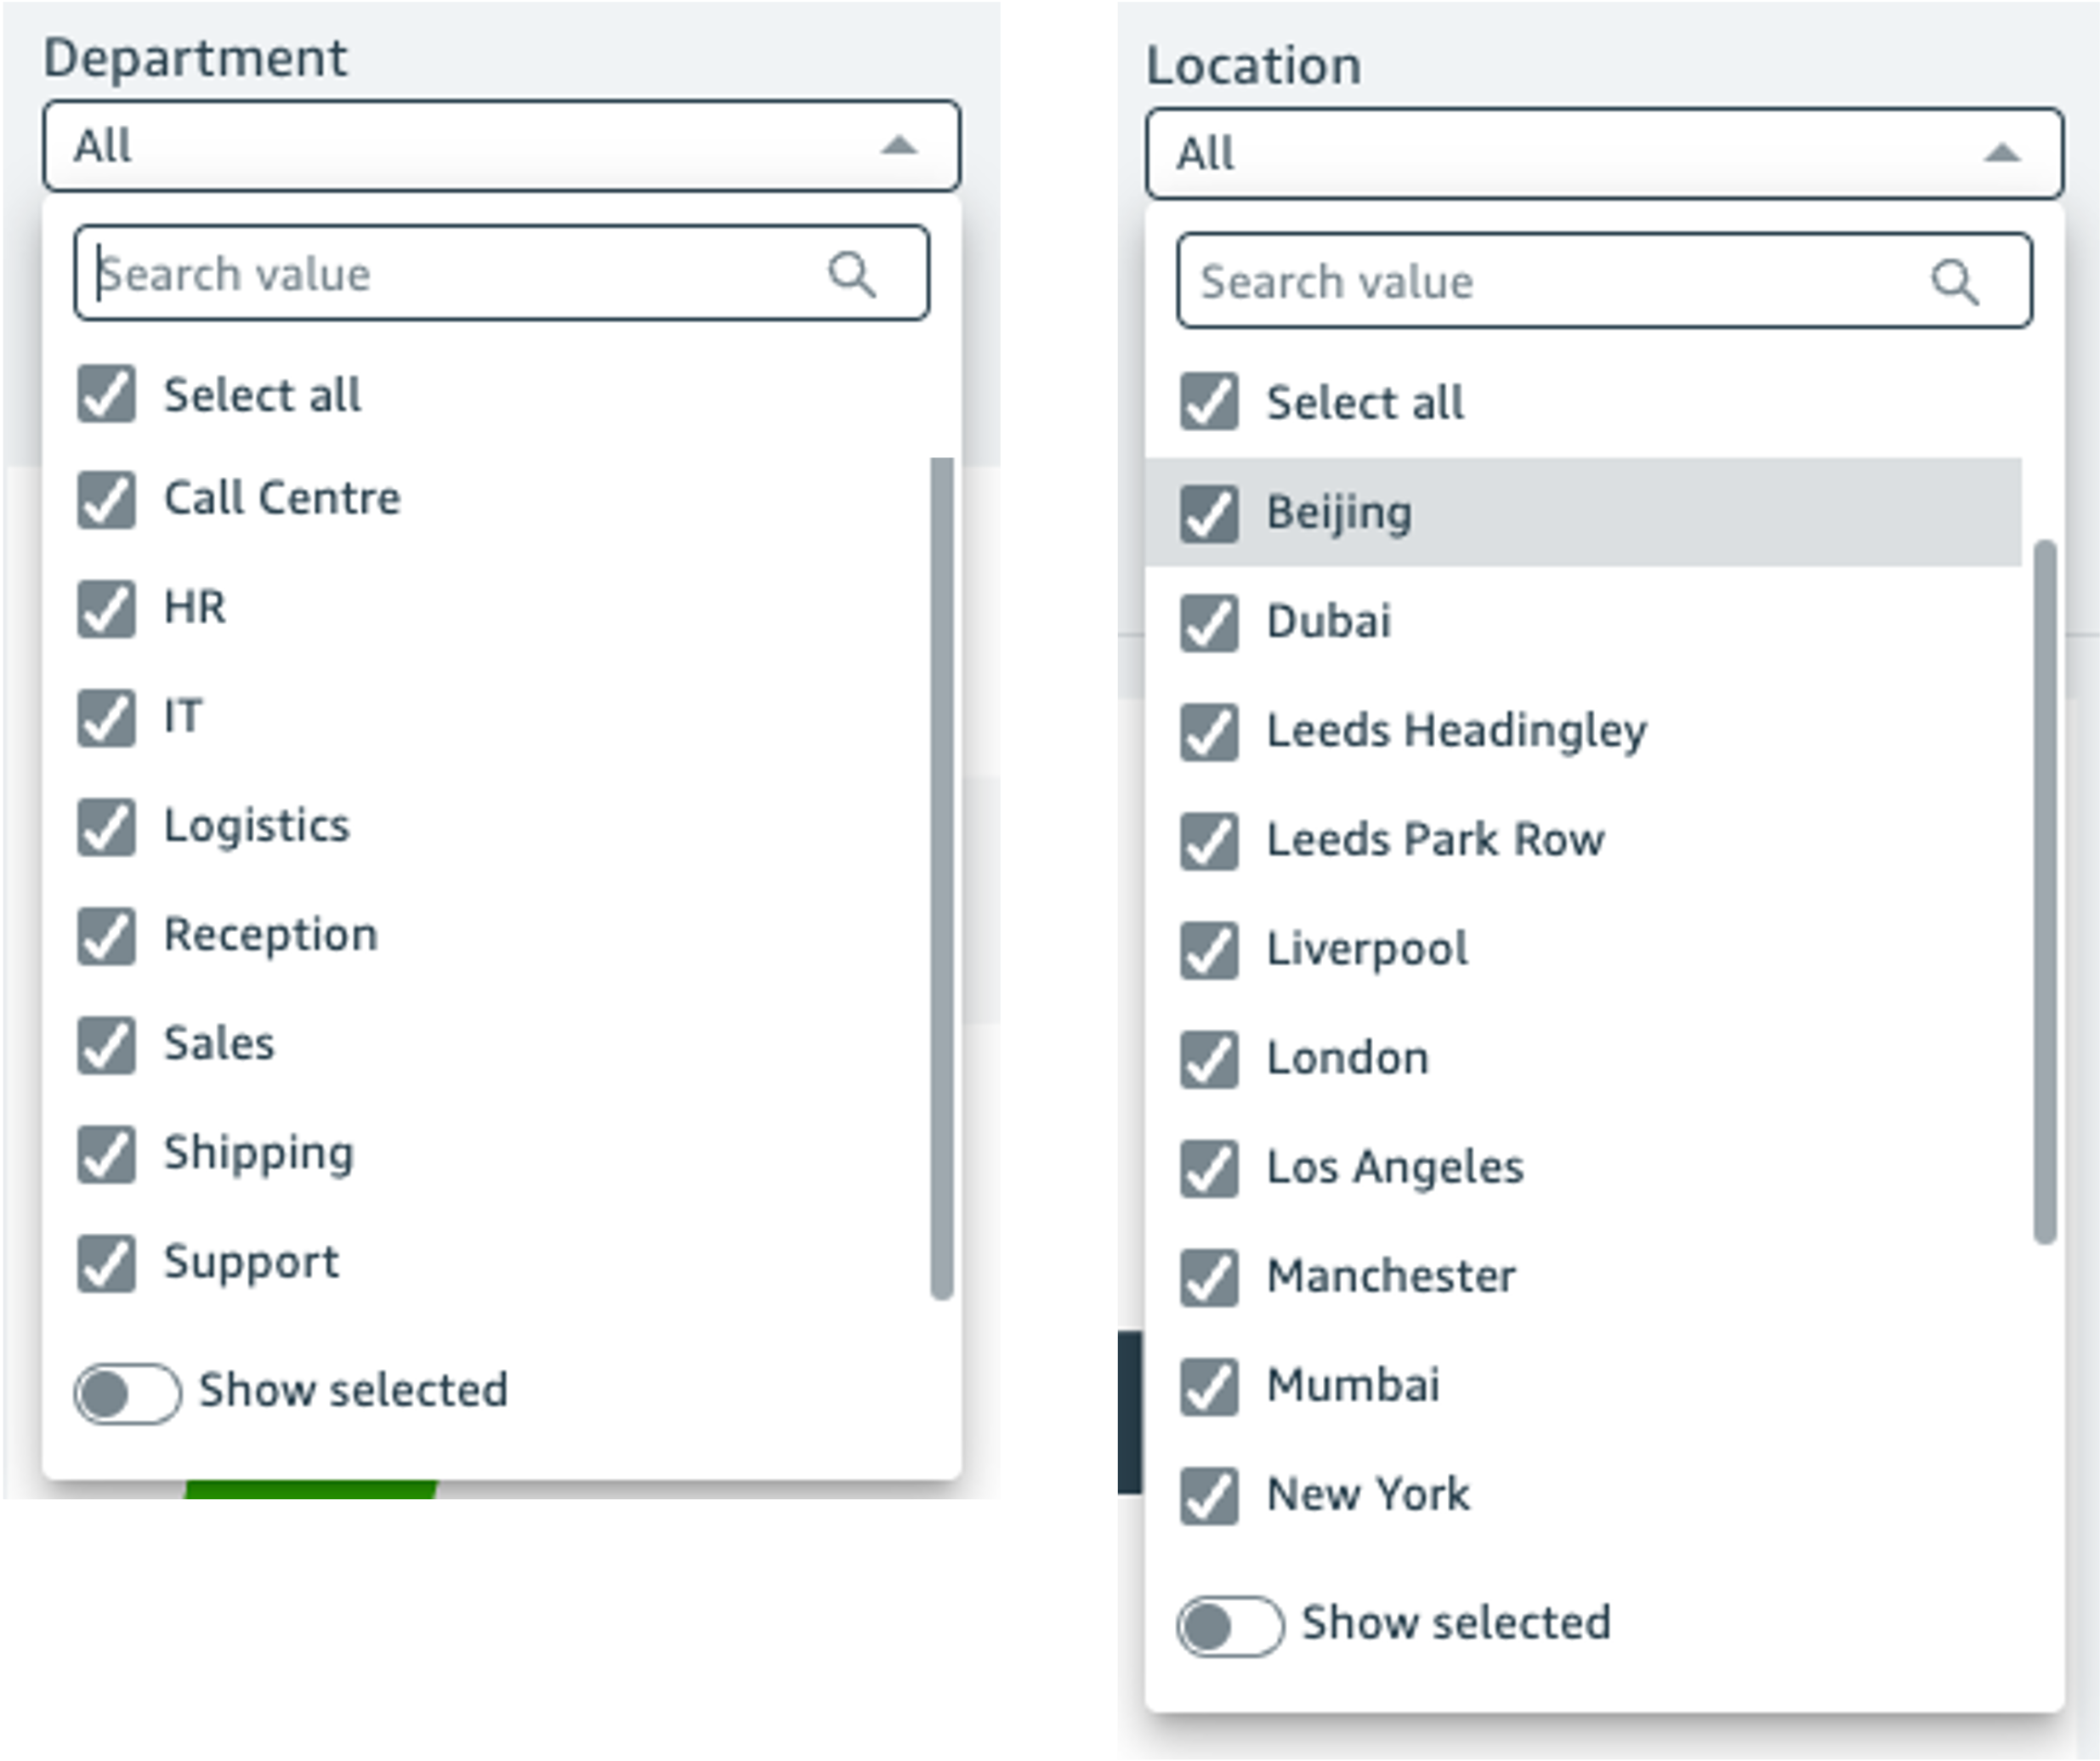
Reporting data can be filtered through a variety of ways. Below are some examples to help you find what you are looking for specifically. The image below shows an example of the filters available at the top of each dashboard, in this case the 'Courses' report.

Filter by Sent Date
To filter by date, click either the 'Start' or 'End' date box. A calendar to select from will appear. Select a date for each of the boxes to filter to a specified time frame.

Filter by User
To filter by email, type an email address into the box located under controls at the top of the page and the underlying data will be filtered to just that specific user.

Filter by Course or Simulation
To filter by Course or Simulation use the Course or Simulation box and select the applicable Course or Simulation.
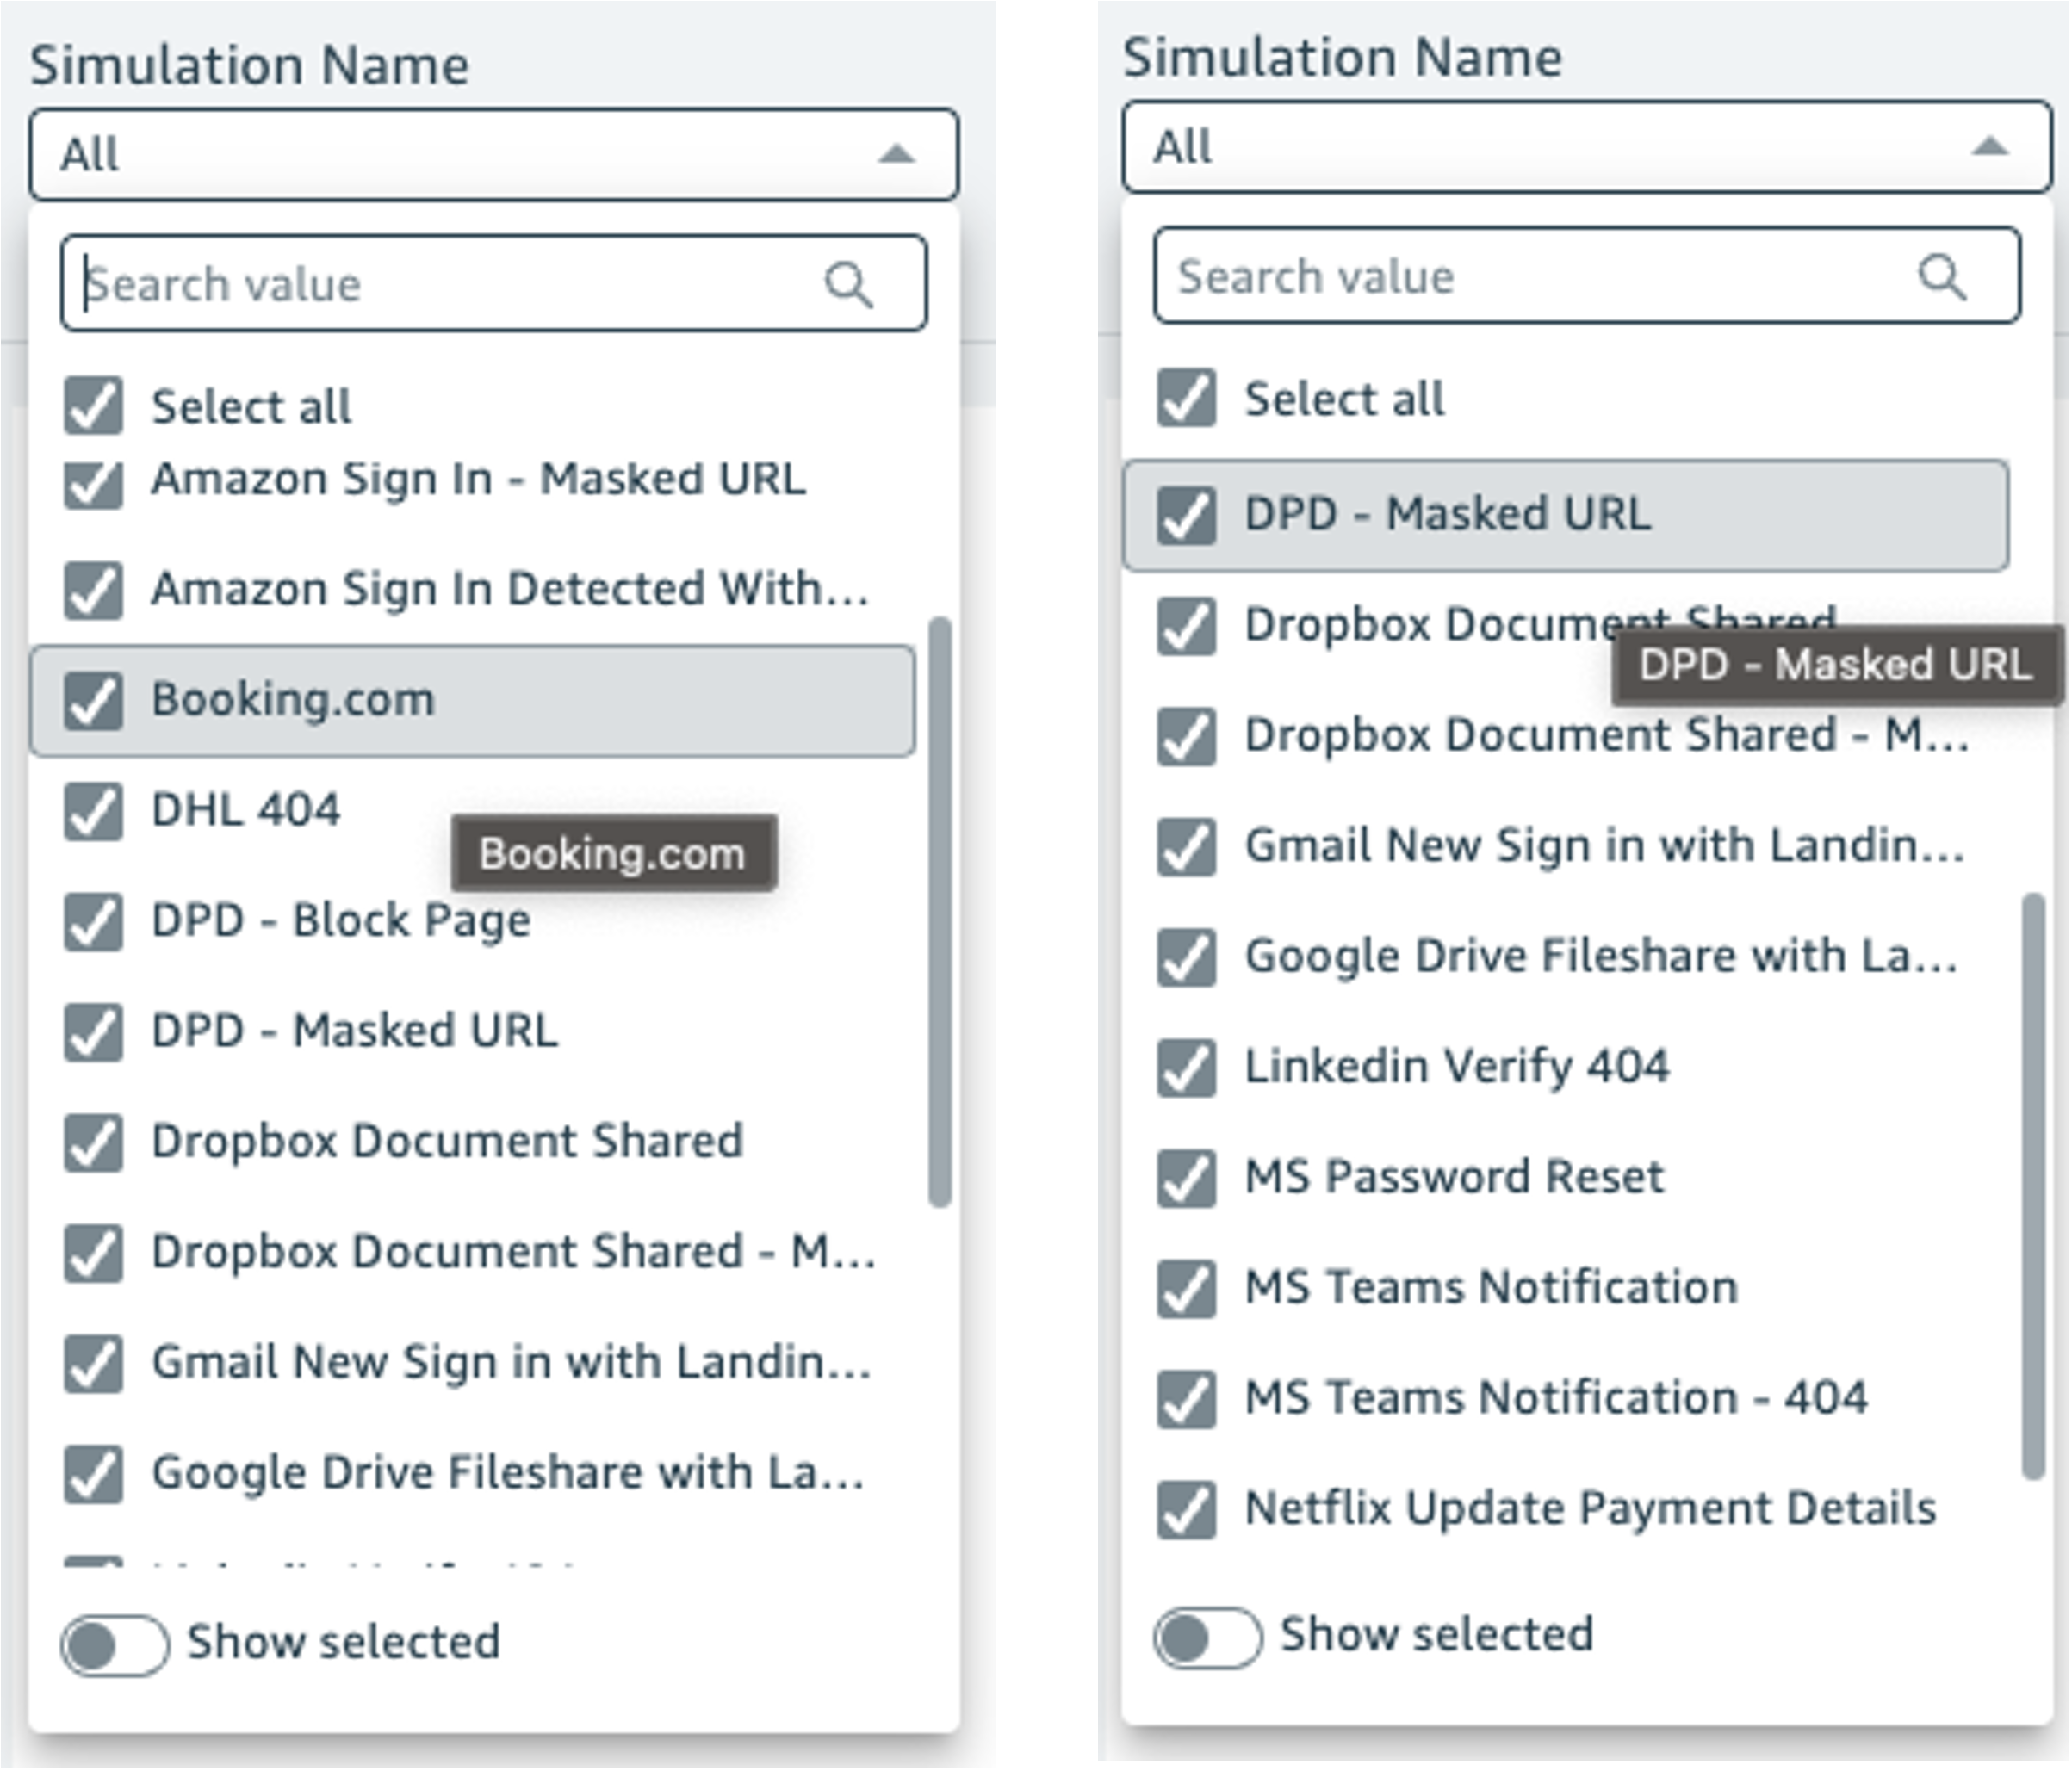
Filter by Department or Location
To filter by Department or Location use the Department or Location box and select the applicable Department or Location.
Filtering from within Visualisations
It is also possible to filter or drill down into specific Courses, Simulations or Users by clicking on the parts of the visualisations themselves. By selecting an item, the full dashboard will be filtered on that attribute. Below are a couple of examples.
- Courses or Simulations
- Select either the 'Courses' or 'Simulations' report
- Navigate to the 'Simulation Engagement' or '% Completed by Course' heatmap.
- Select the box with the title of the Simulation/Course you would like to see
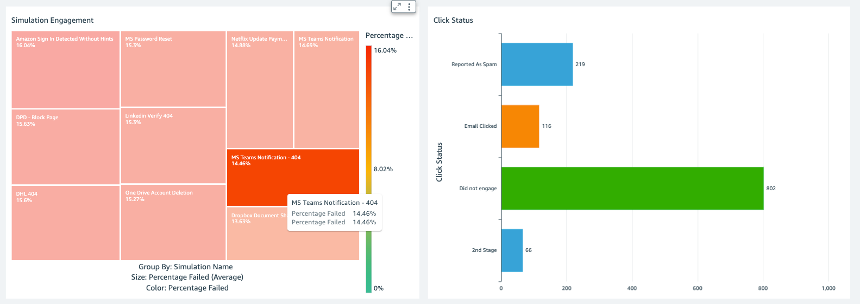
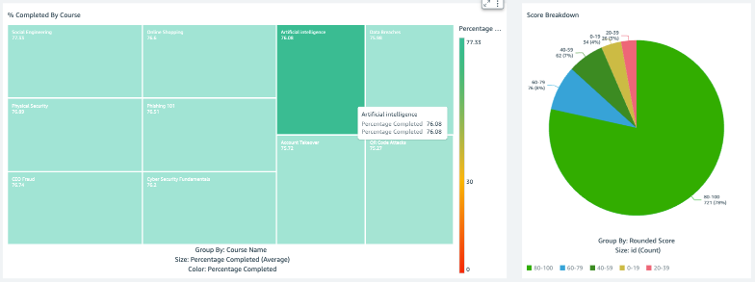
All the data on the page will now be filtered based on the selected Simulation or Course.
- Department or Location
- Select either the Course or Simulation Tab
- Navigate to
- For Sims: 'Simulations Clicked (%) by Department' and 'Simulations Clicked (%) by Location'
- For Courses: 'Courses Completed (%) by Department' and 'Courses Completed (%) by Location'
- Select the Department or Location you would like to view
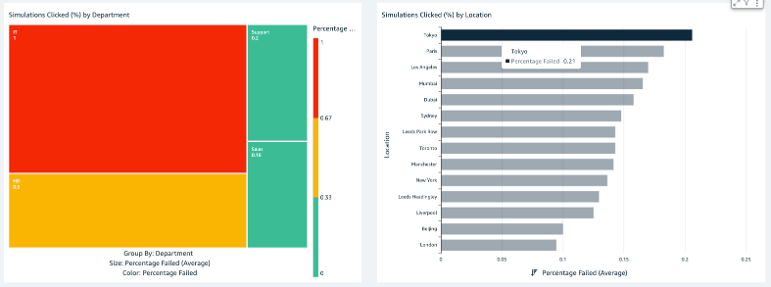
All the data on the page will now be filtered based on the selected Department or Location
Exporting Report Data
It is possible to export each report in full or individual visualisations within a report. To export a report click on the 'Export' icon on the top right of the report, shown below. From here you can either 'Print' directly or 'Generate PDF'.
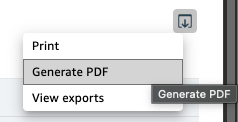
When generating a PDF this will be performed in the background and the user will be informed once it is complete and available to download, shown below.

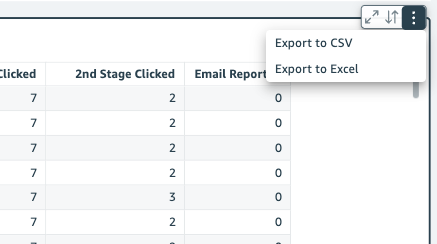
To export the data in a table click on the 'Menu Options' icon on the top right of the table, shown below. From here you can either 'Export to CSV' or 'Export to Excel'.
Help
By selecting the 'Help' option in the left hand menu, shown below, the administrator will be taken to the Knowledge Base that includes various User Guides, How To's and FAQs.
